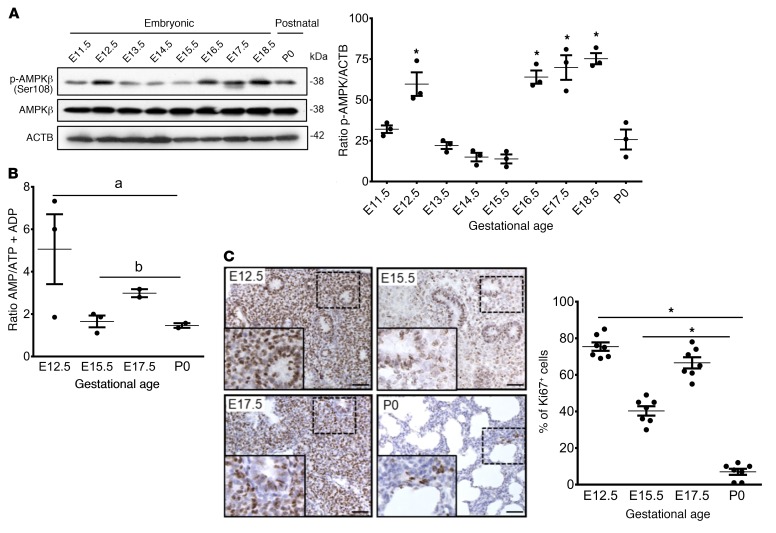
Figure 3. Autophagy is accompanied by AMPK activation during embryonic mouse lung development.
(A) Representative immunoblots of p-AMPKβ (Ser108) and AMPKβ proteins in mouse lung lysates during lung development. Graph shows densitometric analysis of p-AMPKβ (Ser108) during lung development relative to E11.5 lung. ACTB was used as a protein loading control. Results are expressed as the mean ± SEM (n = 3 separate experiments). *P < 0.05 versus E11.5. (B) AMP/ATP plus ADP ratios in embryonic (E12.5, E15.5, and E17.5) and postnatal (P0) lungs. Data show the mean ± SEM (n = 3 separate experiments). aP < 0.05 versus E12.5; bP < 0.05 versus E17.5. (C) Representative IHC images for Ki67 expression in embryonic (E12.5, E15.5, and E17.5) and postnatal (P0) lung tissue. Scale bars: 50 μm. Graph shows quantitative analysis of Ki67+ cells per mm2. Results are expressed as the mean ± SEM (n = 3 separate lungs). *P < 0.05 versus E12.5. Statistical significance for all data was determined by 1-way ANOVA followed by Tukey’s post hoc test.

