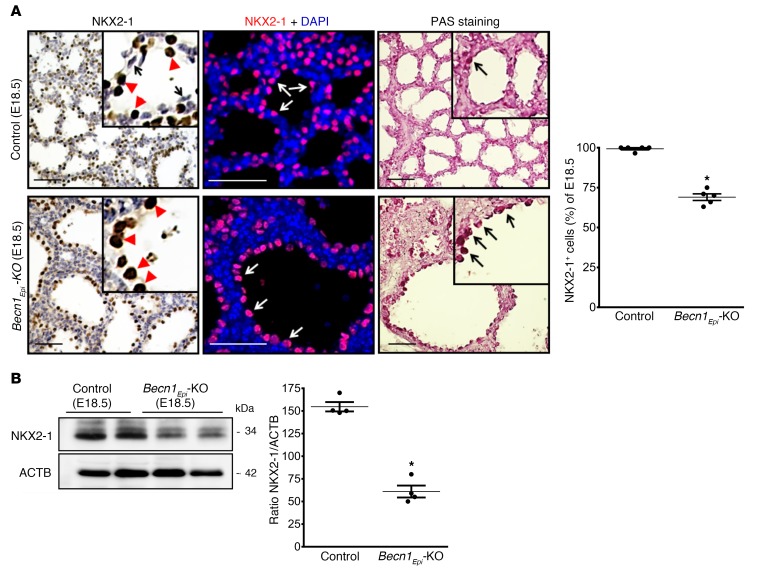
Figure 9. Conditional deletion of Becn1 reduces NKX2-1 expression.
(A) IHC and confocal IF microscopic images show NKX2-1 and glycogen content (PAS staining) in lung tissue sections from E18.5 Becn1Epi-KO and littermate control (WT) fetuses. In the littermate control, the type II cuboidal alveolar cells stained positive for NKX2-1 (top left inset, red arrowheads), whereas type I squamous alveolar cells lacked NKX2-1 expression (top left inset, black arrows). In the Becn1Epi-KO lung, only NKX2-1+ cuboidal cells were visible (bottom left inset, red arrowheads). In the IF staining (middle panel), NKX2-1+ cells are shown in red, whereas nuclei were stained with DAPI (blue). Scale bars: 50 μm. Graph shows densitometric analysis of NKX2-1 IF results. Data represent the mean ± SEM (n = 4 separate lungs). *P < 0.05 versus control, by Student’s t test. (B) Representative immunoblot for NKX2-1. Graphs shows densitometric analysis of NKX2-1 expression in whole-lung lysate harvested from Becn1Epi-KO and littermate control embryos at E18.5. ACTB was used as a protein loading control. Data represent the mean ± SEM (n = 4 separate lungs). *P < 0.05 versus WT control, by Student’s t test.

