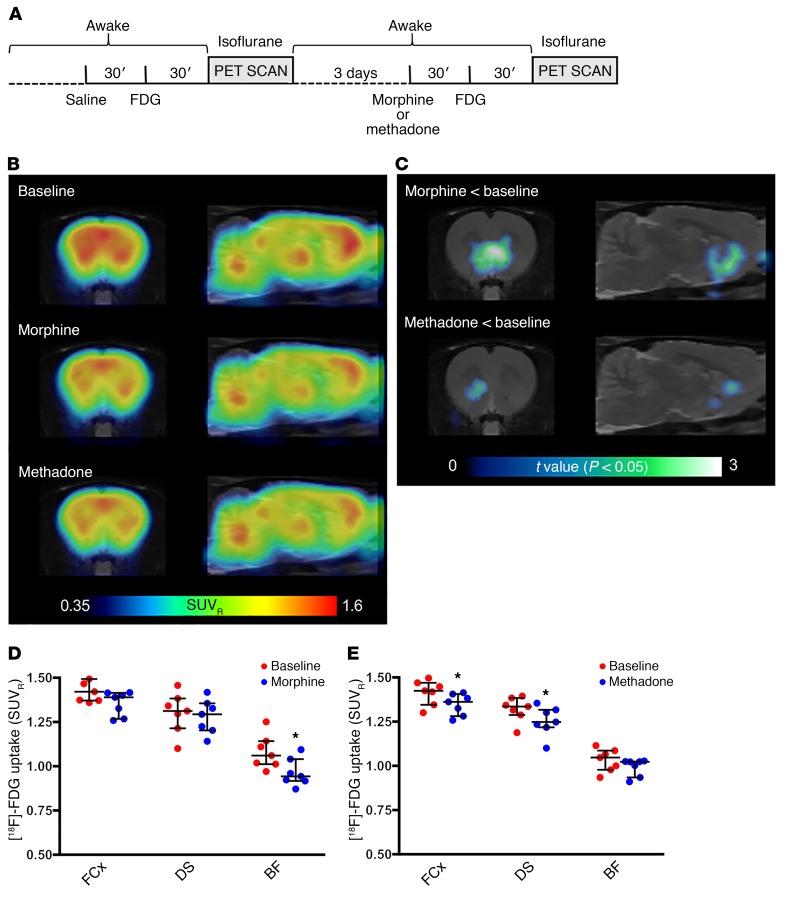
Figure 4. Differential ability of morphine and methadone to influence metabolic activity in the basal forebrain.
Metabolic mapping using [18F]FDG PET scanning in rats. (A) Timeline of the experiment. (B) [18F]FDG uptake after administration of saline (baseline, n = 14), morphine (1 mg/kg, n = 7), or methadone (1 mg/kg, n = 7). Coronal and sagittal images (1.5 mm anterior to bregma and 1.4 mm lateral from the midline, respectively) show the average SUVR calculated using the whole brain as a reference region. (C) Voxel-based parametric mapping analyses revealed significantly decreased metabolic activity from baseline values in a basal forebrain region that included the NAc and its projecting areas after morphine, but not methadone, treatment. Statistical parametric maps of significant decreases of [18F]FDG uptake (P < 0.05, paired t test). (D and E) VOI analyses of the frontal cortex (FCx), dorsal striatum (DS), and basal forebrain (BF) region, showing a significant differential pattern of [18F]FDG uptake after administration of morphine (D) or methadone (E). Values are shown as dots and as the median with interquartile ranges. *P < 0.05 versus the corresponding baseline value; 2-tailed Wilcoxon matched-pairs test (n = 7 animals/group).

