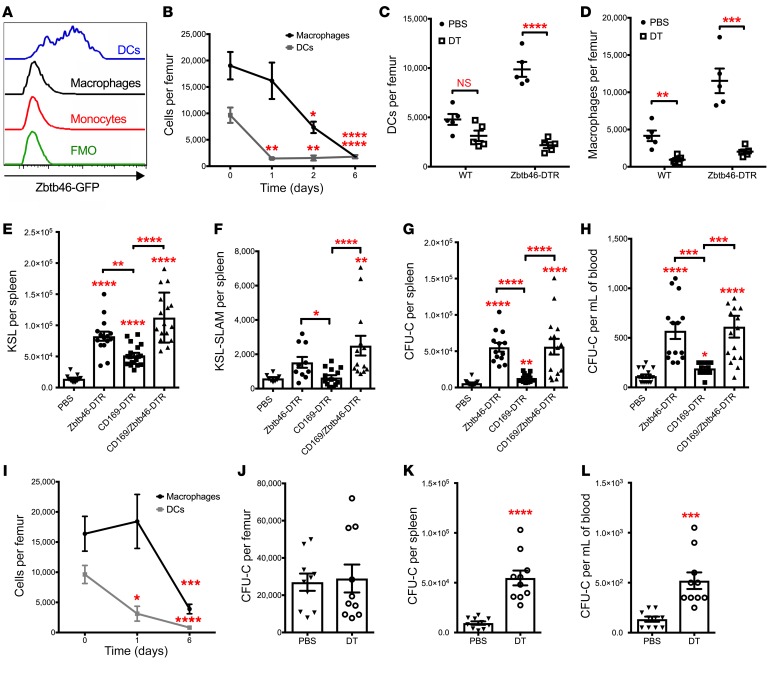
Figure 2. Bone marrow DC ablation induces a loss of macrophages and HSPC mobilization.
(A) Expression of GFP in bone marrow monocytes (Gr-1lo B220– CD115+ cells), macrophages (Gr-1lo B220– MHC-II+ F4/80+ cells), and DCs (Gr-1lo B220– MHC-IIhi CD11chi cells) from Zbtb46gfp mice is shown. FMO, fluorescence minus one control. (B) Zbtb46dtr bone marrow chimeras were treated with DT for 1 day (n = 5 mice), 2 days (n = 5 mice), 6 days (n = 12 mice), or with PBS (day 0) (n = 11 mice), and BM DCs and macrophages were quantified. (C, D) Mixed bone marrow chimeras containing WT and Zbtb46dtr cells were treated with PBS or DT for 6 days, and the number of DCs (C) and macrophages (D) in the bone marrow that were derived from WT or Zbtb46dtr (Zbtb46-DTR) cells were quantified (n = 5 mice per cohort). (E–H) Zbtb46dtr, CD169dtr (CD169-DTR), and CD169dtr × Zbtb46dtr (CD169/Zbtb46-DTR) chimeras were treated with PBS or DT for 6 days, and the number of lineage- sca1+ c-kit+ (KSL) cells (E) (n = 11, 15, 18, 16 mice) or CD150+ CD48– KSL (KSL-SLAM) cells in the spleen (F) (n = 8, 10, 14, 13 mice) and the number of colony-forming cells (CFU-C) in spleen (G) (n = 14, 13, 12, 15 mice) or blood (H) (n = 15, 14, 12, 16 mice) were quantified. (I) CD11cdtr chimeras were treated with DT for 1 day (n = 3 mice), 6 days (n = 10 mice), or with PBS (n = 10 mice), and BM DCs and macrophages were quantified by flow cytometry. (J–L) CD11cdtr bone marrow chimeras were treated with saline or diphtheria toxin (DT) for 6 days, and the number of CFU-C in bone marrow (J), spleen (K), and blood (L) was quantified (n = 10 mice per cohort). Data are mean ± SEM. *P < 0.05; **P < 0.01; ***P < 0.001; ****P < 0.0001 compared with PBS-treated or day 0 mice. Significance was determined using an ANOVA with Tukey’s Honest Significant Difference post hoc analysis for C, E–H, a 2-way ANOVA for B, I, or an unpaired Student’s t test for J–L.

