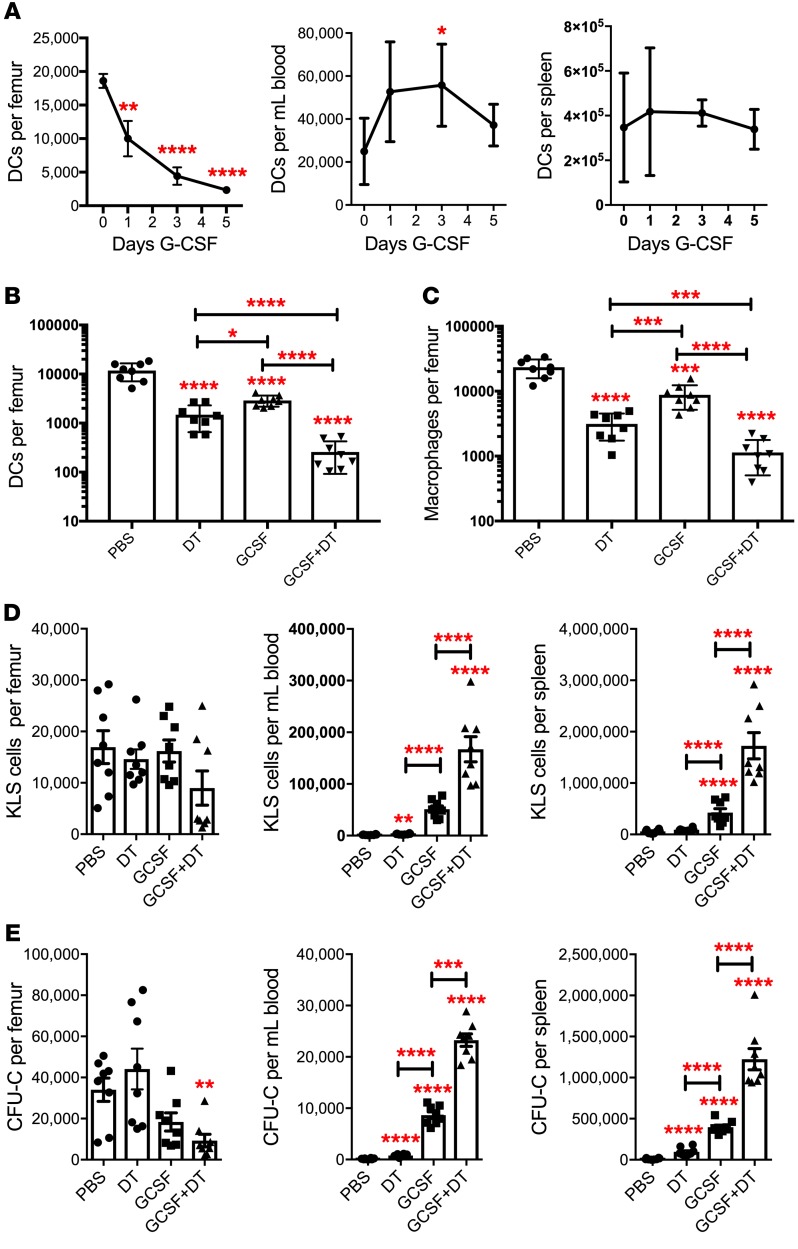
Figure 3. Bone marrow DC ablation synergizes with G-CSF to mobilize HSPCs.
(A) Mice were treated with 250 μg/kg G-CSF daily for 5 days. Shown are the number of cDCs in the bone marrow, blood, and spleen (n = 5, 4, 4 and 6 mice per time point). (B–E) Mice were treated with saline alone (PBS), G-CSF for 5 days, or the combination of DT and G-CSF for 5 days (n = 8 mice per cohort). The number of cDCs (B) and macrophages (C) in the bone marrow is shown. The number of KSL (D) or CFU-C (E) in bone marrow, blood, and spleen are shown. Data are mean ± SEM. *P < 0.05; **P < 0.0; ***P < 0.001; ****P < 0.0001 compared with saline-treated mice. Significance was determined using a 2-way ANOVA for A or an ANOVA with Tukey’s Honest Significant Difference post hoc analysis for B–E.

