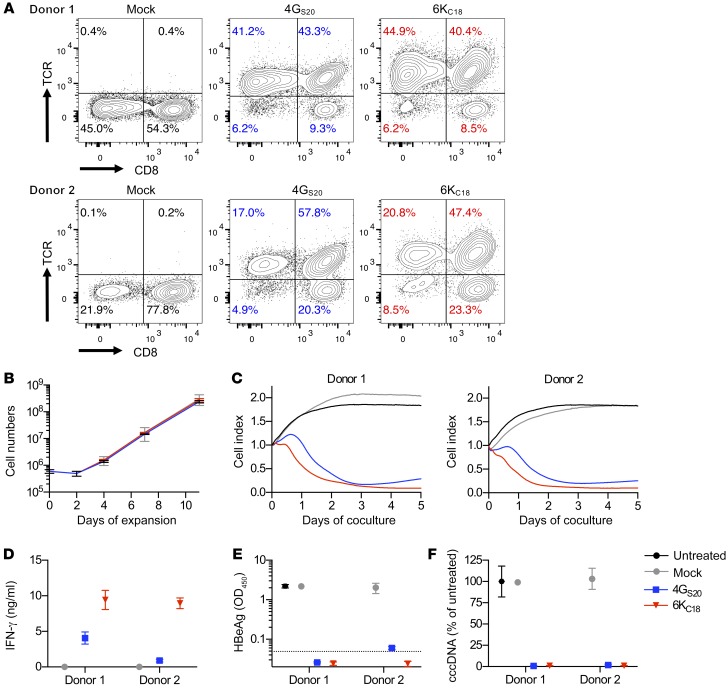
Figure 3. Antiviral activity of T cells from patients with CHB.
(A) CD3+ T cells from 2 donors with CHB were isolated and transduced to express the HBV-specific TCRs 4GS20 (blue) and 6KC18 (red). TCR expression was quantified by flow cytometry. (B) Expansion of T cells during retroviral transduction with CD3/CD28 T activator Dynabeads and IL-2. (C–F) HepG2-NTCP cells were infected with HBV at a MOI of 500 three weeks prior to coculture with TCR-grafted T cells from donors with CHB at an E/T ratio of 1:2. Since the ratio of CD4+ and CD8+ T cells varied substantially between the donors, effector cell numbers were calculated on the basis of TCR+ CD8+ T cells only. (C) Killing of target cells was measured using a real-time cell analyzer and is given as the normalized cell index relative to the starting point of the coculture. E/T of 1:2.7. (D) IFN-γ was determined in cell culture medium on day 2. Secreted HBeAg (E) and intracellular HBV cccDNA (F) levels were measured after 10 days of coculture. Data are presented as mean values of triplicate cocultures (n = 3).

