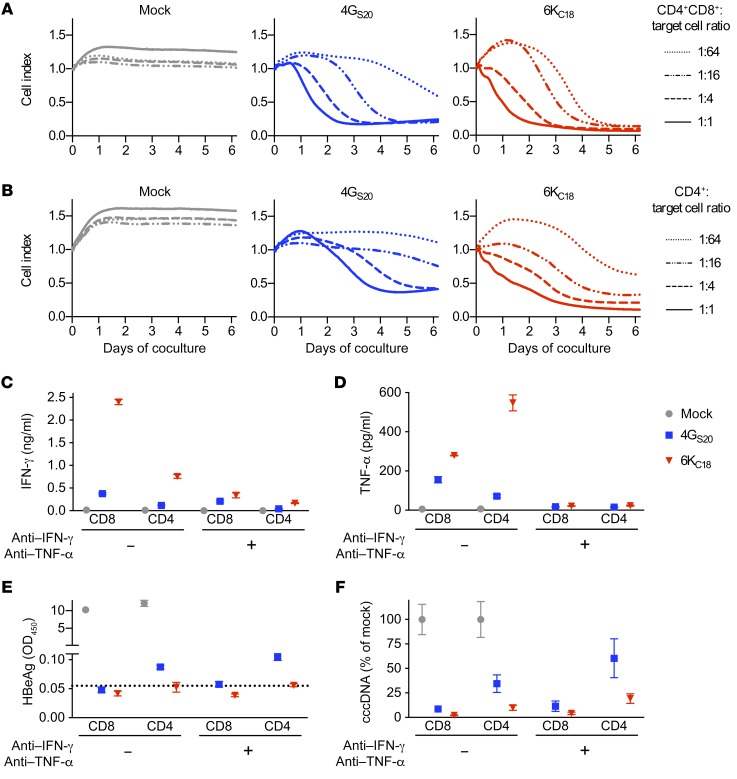
Figure 4. Antiviral activity of different TCR-grafted T cell subsets.
HepG2-NTCP cells were infected with HBV at a MOI of 500. After 2 to 3 weeks, T cells grafted with the TCRs 4GS20 (blue squares) or 6KC18 (red triangles) or nontransduced T cells (mock, gray circles) were added at decreasing E/T ratios. (A and B) Killing of target cells determined by detachment from the bottom of the 96-well plate was measured in real-time (xCELLigence) and is given as the normalized cell index relative to the starting point of the coculture with CD4+CD8+ T cells (A) or CD4+ T cells only (B). (C–F) CD8+ and CD4+ T cells were separated by positive magnetic cell sorting and added at an E/T ratio of 1:2. Cytokine-blocking antibodies against IFN-γ (10 ng/ml) or TNF-α (5 ng/ml) were given every other day when medium was exchanged. (C and D) IFN-γ and TNF-α were measured in the cell culture medium after 2 days. (E) Secreted HBeAg and (F) intracellular HBV cccDNA levels were measured after 10 days of coculture. Data are presented as mean values (A and B) or mean values ± SEM (C–F) of triplicate cocultures (n = 3).

