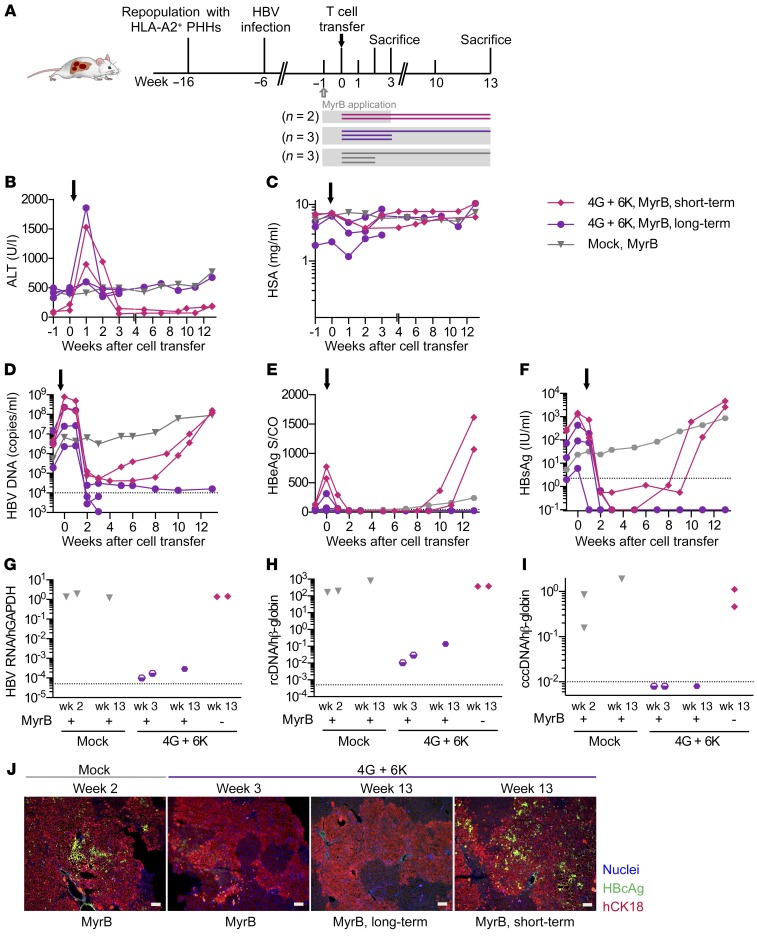
Figure 7. Long-term follow-up of mice partially infected with HBV and treated with HBV-specific T cells and an entry inhibitor.
(A) USG mice were repopulated with HLA-A*02–matched PHHs and infected with 1 × 10⁷ HBV virions. Viral spreading was stopped at week 5 after infection by administration of MyrB (see Methods) (gray blocks). After 1 week of MyrB application, 2 × 10⁶ TCR-grafted T cells (1 × 10⁶ with 6KC18 plus 1 × 10⁶ with 4GS20, n = 5) or mock T cells (gray triangles, n = 3) were transferred. To address the question of whether mice could be reinfected after treatment with effector T cells, MyrB application was stopped in 2 of 5 mice after 3 weeks (MyrB short-term, pink diamonds, n = 2) and followed up until week 13. MyrB was administered continuously in 3 of 5 mice (MyrB long-term, purple circles, n = 3). Mice were sacrificed at week 2 or 3 during short-term follow-up or at week 13 during long-term follow-up. Time course of ALT activity (B), HSA (C), HBV viremia (D), HBeAg (E), and HBsAg (F) in sera followed until week 3 or 13. (G) pgRNA levels were normalized to human GAPDH RNA. (H and I) rcDNA and cccDNA levels were quantified relative to an HBV plasmid standard curve and normalized to human β–globin. Each data point or longitudinal line represents 1 mouse. Dotted lines represent the technical cutoff of the respective test. For DNA and RNA analyses, dotted lines indicate the LLoD, defined as 35 cycles of RT-PCR for pgRNA and 10 HBV DNA or cccDNA copies per 1000 or more human β–globin copies. Dots below the LLoD symbolize undetectable measurements. (J) Representative staining of liver tissue slides from mice treated with either mock or 4G plus 6K effector T cells. Scale bars: 50 μm.

