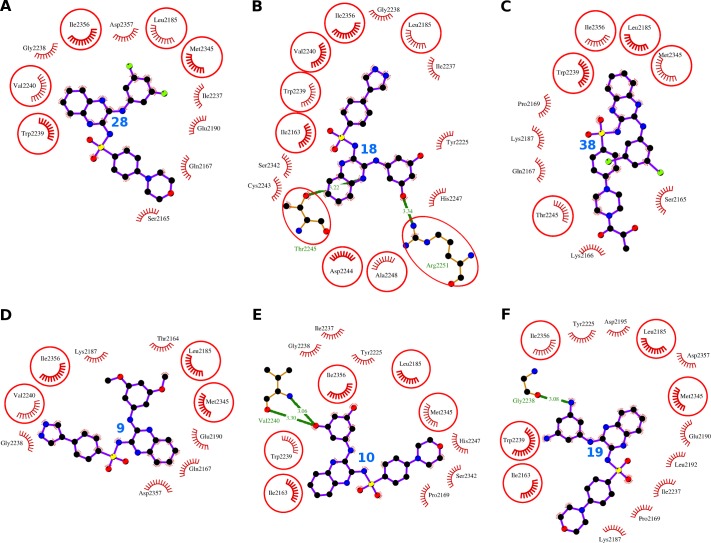
Fig 8. Comparative mTOR binding analysis of the compounds 28, 18, 38, 9, 10, and 19.
The hydrogen bonds are presented as green-dashed lines labeled with bond lengths and the residues participating in non-bonding interactions are presented as red arcs. The interacting residues which are common with the interacting residues of XL765 are encircled.

