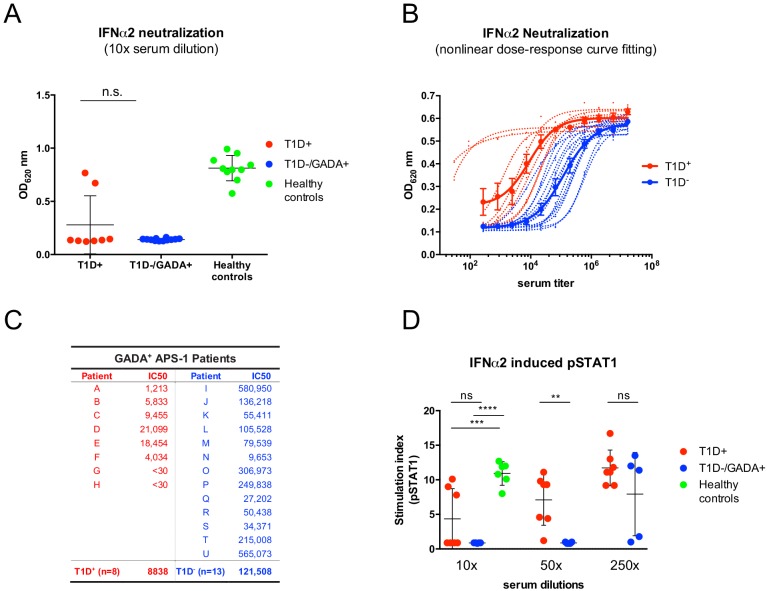
Figure 1. The comparison of two different strategies to measure IFNα neutralizing capacity of APECED/APS1 serum samples.
In panel (A), the same reporter cell assay (HEK-Blue IFN-α/β cells from InvivoGen) has been applied as in Meyer et al. (2016) but at a single high serum concentration (ns: not significant). (B) Representative fitted dose-response curves that were used in Meyer et al. (2016) to calculate IC50 values for each serum sample. Individual curves are represented with dotted lines and those for grouped values in solid lines (mean ± SEM). (C) IC50 values (expressed as the dilution of serum sufficient to neutralize 50% of IFNα2 activity [12.5 U/ml]) that were calculated from individual and grouped curves shown in panel B. APECED/APS1 patients with Type 1 diabetes (T1D) are depicted in red and APECED/APS1 patients with GAD65 autoantibodies (GADA) but without T1D are in blue. (D) Neutralization of IFNα2 activity (10 000 U/ml) required to induce pSTAT1 was tested with different dilutions of sera from GAD seropositive patients with and without T1D. 2-way ANOVA was used to calculate P-values [ns – not significant, **p≤0.01, ***p≤0.001, ****p≤0.0001].

