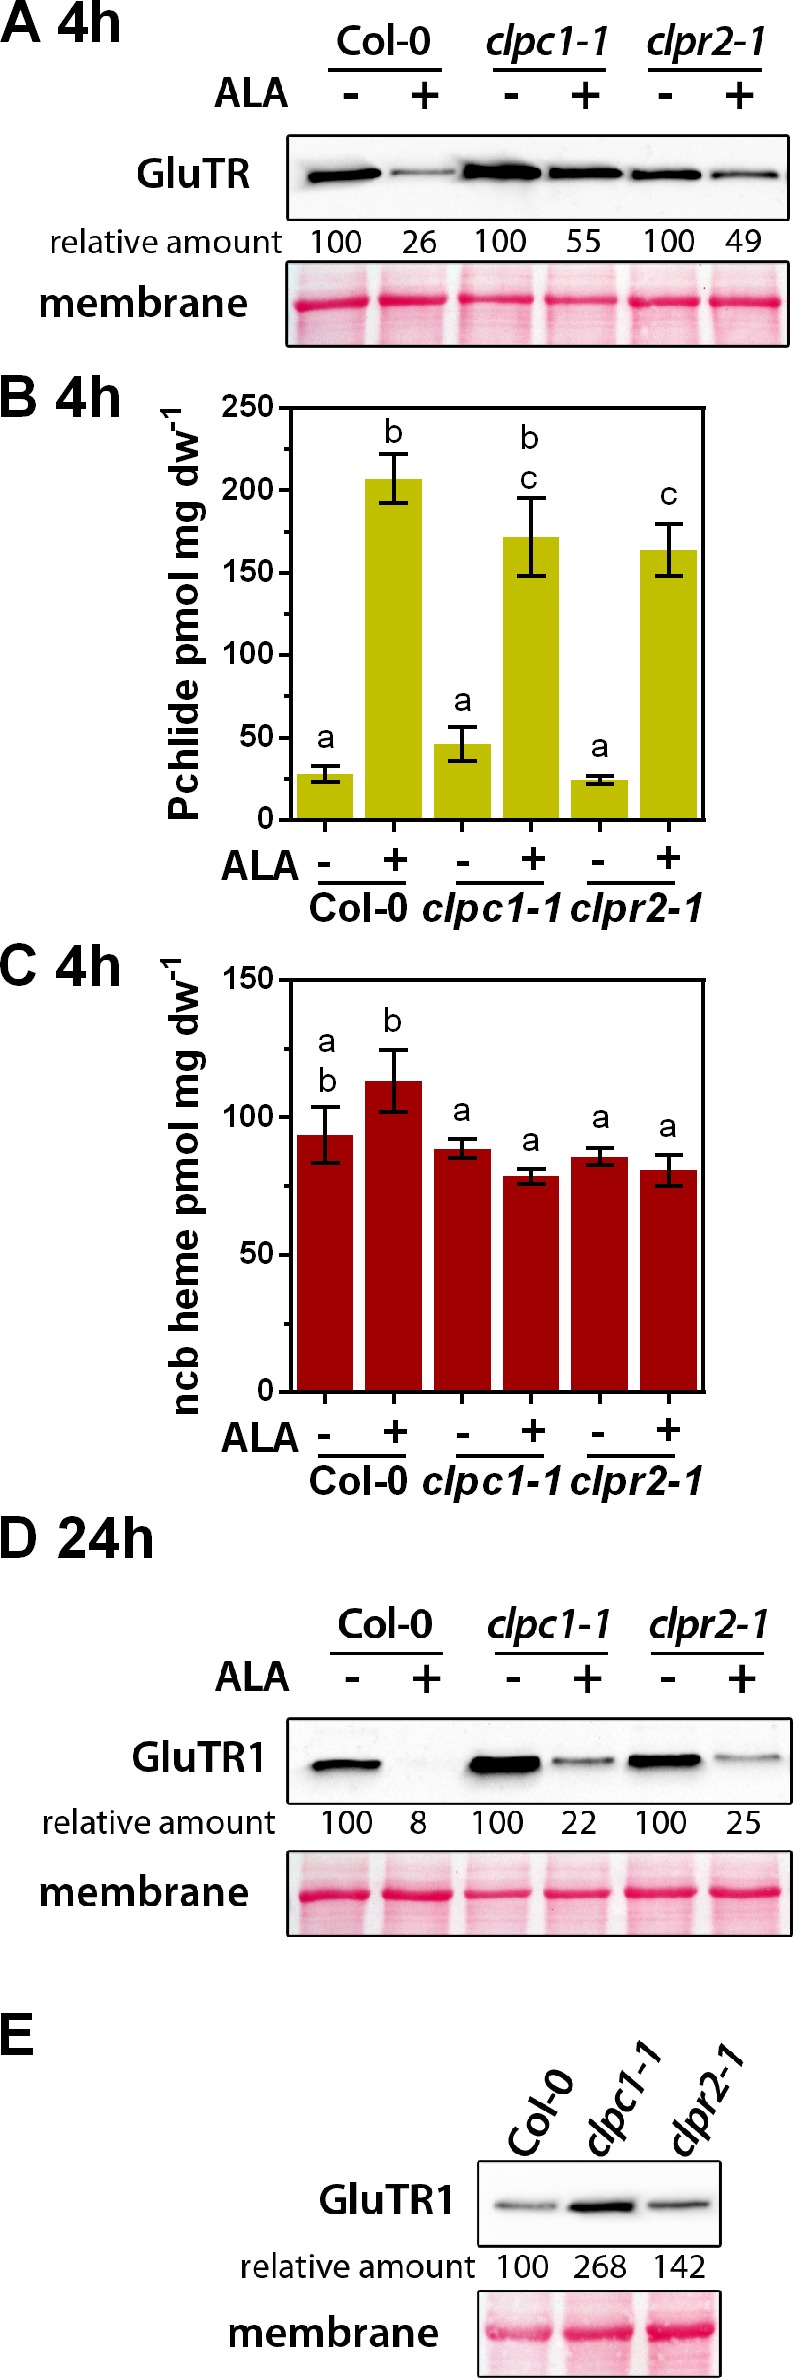
Figure 2. ALA-induced proteolysis of GluTR1 is attenuated in clpc1-1 and clpr2-1 mutants.

(A) Western blot analysis of 14-day-old GluTR1 in Col-0, clpc1-1 and clpr2-1 leaves incubated in buffer without (-) or with (+) 1 mM ALA for 4 hr in darkness. Signal intensities for GluTR1 relative to Col-0 without ALA treatment are shown. (B, C) Pchlide (B) and non-covalently bound (ncb) heme (C) contents of genotypes analyzed in (A) after 4 hr of treatment. Data are given as means ± sd (n = 3). Letters indicate statistical groups determined by Student’s t-test (p<0.05). (D) Western analysis of GluTR1 in Col-0, clpc1-1 and clpr2-1 incubated in buffer without (-) or with (+) 1 mM ALA for 24 hr in darkness. Signal intensities for GluTR1 in protein extracts of the genotypes treated without (- ALA = 100%) and with ALA (+ALA) are shown. (E) GluTR1 content of Col-0, clpc1-1 and clpr2-1 seedlings grown under short-day conditions. Samples were harvested 2 hr after the onset of light. Signal intensities for GluTR1 are shown relative to Col-0.
