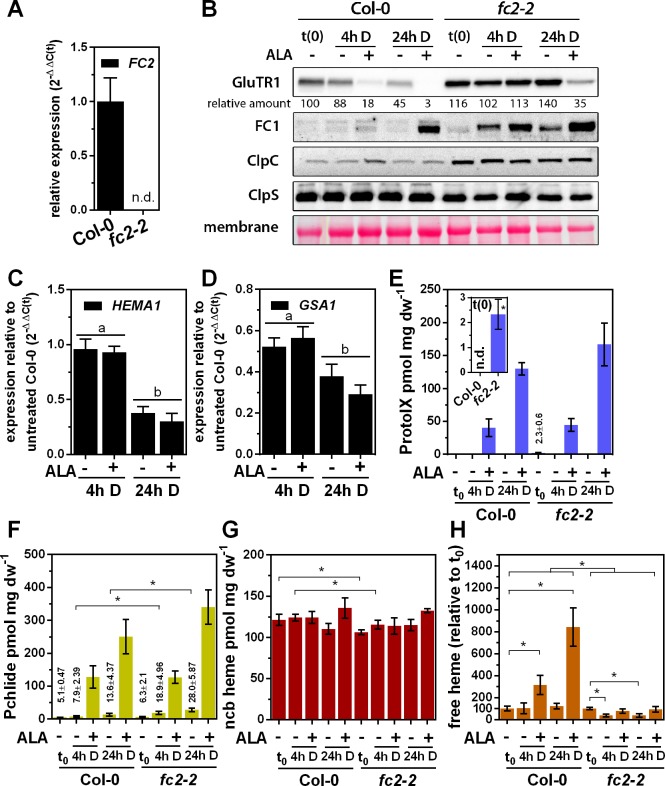
Figure 5. Altered ALA-induced proteolysis of GluTR1 in FC2 knockout mutants.
(A) Levels of FC2 mRNA in light-grown Col-0 and fc2-2 plants, analyzed by qRT-PCR. Data are given as mean ± sd (n = 3). n.d., not detectable (B) Levels of GluTR1, FC1, ClpC and ClpS in leaves of Col-0 and fc2-2 plants incubated without (-) or with (+) 1 mM ALA in darkness (D) for the indicated times. Signal intensities for GluTR1 relative to Col-0 seedlings harvested before the beginning of the experiment (Col-0 t(0)) are shown (D, dark). (C) and (D) Levels of HEMA1 (C) and GSA1 (D) mRNAs in fc2-2 mutants plotted relative to untreated Col-0 seedlings harvested before start of the experiment. Data are given as mean ± sd (n = 4). Letters indicate statistical groups determined by Student’s t-test (p<0.05). (E) Protoporphyrin IX (ProtoIX), (F) Pchlide, (G) ncb heme and (H) free heme contents of Col-0 and fc2-2 leaves treated as in (B). The inset in E shows the steady-state level of ProtoIX in untreated seedlings before ALA treatment (t0). Data are given as mean ± sd (n = 4). Asterisks denote statistically significant changes between samples with p<0.05 (Student’s t-test). Statistical analysis was performed before the calculation of ratios. n.d., not detectable. 21-day-old, light-grown plants were analyzed.


