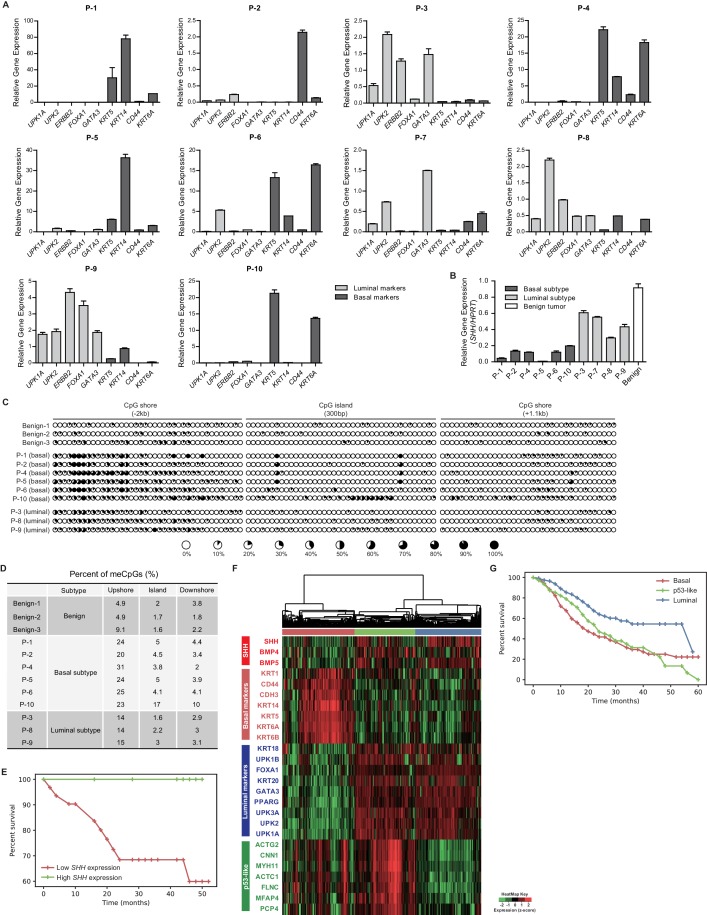
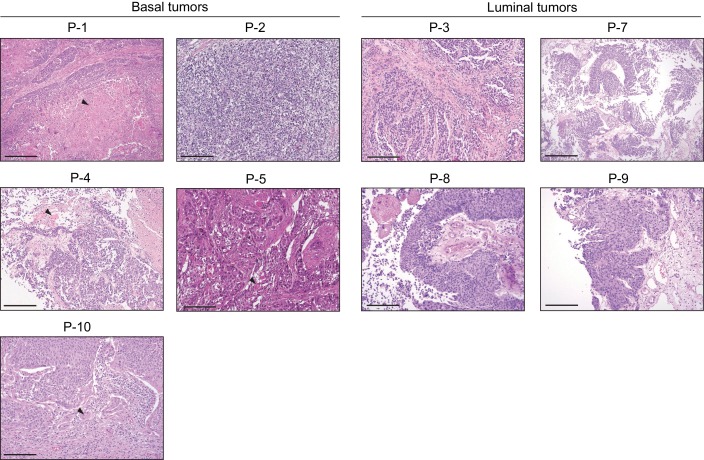
Figure 7. Expression analysis of patient-derived urothelial carcinomas and large-scale transcriptional analyses.
(A) The relative expression of basal (KRT5, KRT14, CD44 and KRT6A) and luminal markers (UPK1A, UPK2, ERBB2, FOXA1 and GATA3) was analyzed in human invasive urothelial carcinomas from 10 patients. Data are presented as the mean ± SEM. n = 3 technical replicates (B) Expression of SHH in benign urothelium (white bar) and two subtypes of invasive urothelial carcinomas (basal, dark grey bars; luminal, light grey bars) from patients. Data are presented as the mean ± SEM. n = 3 technical replicates. (C) The methylation status of the CpG island and CpG shore regions of the human SHH gene was analyzed by bisulfite sequencing in human invasive urothelial carcinoma tissues from patients (three benign tissues, six basal tumors, and three luminal tumors). The average degree of methylation is indicated by the black portion of the white circle. (D) The results obtained from bisulfite sequencing analysis of (C) are summarized. (E) Kaplan-Meier survival curve from a set of 41 patients with muscle-invasive bladder cancer from Seoul National University Hospital. Patients were classified by the expression level of SHH (high in green, n = 10; low in red, n = 31). The high- and low-SHH groups were determined by an SHH/18S value greater or less than 0.288, respectively. (F) Stratification of gene expression in RNA-seq data from the TCGA database of muscle-invasive urothelial carcinoma. Heatmap showing the expression levels (z-score normalized log2 (FPKM +1) values) of SHH, basal markers, luminal markers and p53-like markers. Based on unsupervised hierarchical clustering, three subgroups were identified: basal (red cluster, n = 125), p53-like (green, n = 106) and luminal (blue, n = 118). (G) Survival analysis of patients in the three subgroups. Basal (n = 125), p53-like (n = 106) and luminal (n = 118) subtypes are indicated by red, green and blue, respectively. The basal subtype was associated with lower median survival (27.79 months) than the luminal subtype (40.04 months) and p53-like subtype (28.73 months). Note that the basal subtype exhibited a significantly shorter life-span than the luminal subtype (log rank p<0.0001). See also Figure 6—figure supplement 1D,E,F,G and Tables 1 and 2.


