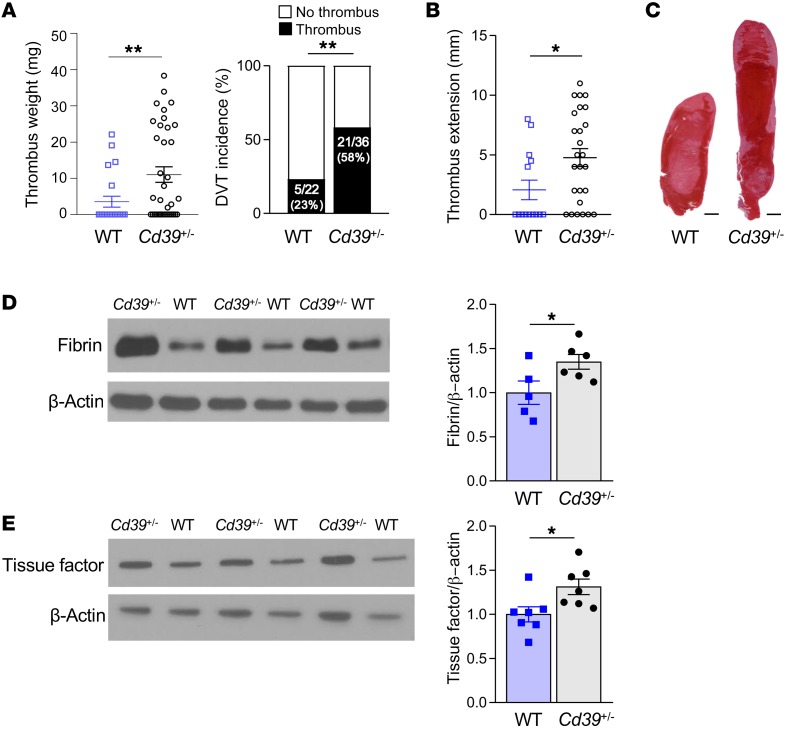
Figure 1. Increased venous thrombogenesis, clot extension, and fibrin content in Cd39+/– mice compared with genotype controls.
(A) Thrombus weights and thrombus frequency 2 days after IVC flow restriction (stenosis) (WT n = 22, Cd39+/– n = 36). (B) Thrombus extension (WT n = 14, Cd39+/– n = 26). (C) Representative H&E-stained sections of thrombi (n = 5, each). Scale bars: 1 mm. (D) Immunoblots of fibrin content of thrombus lysates (WT n = 5, Cd39+/– n = 6) and (E) tissue factor (n = 7 for each). Data represent the mean ± SEM. *P < 0.05 and **P < 0.01, by 2-tailed Student’s t test (D and E) with Welch’s correction (A and B). Data shown in the right panel in A were analyzed using the χ2 method.

