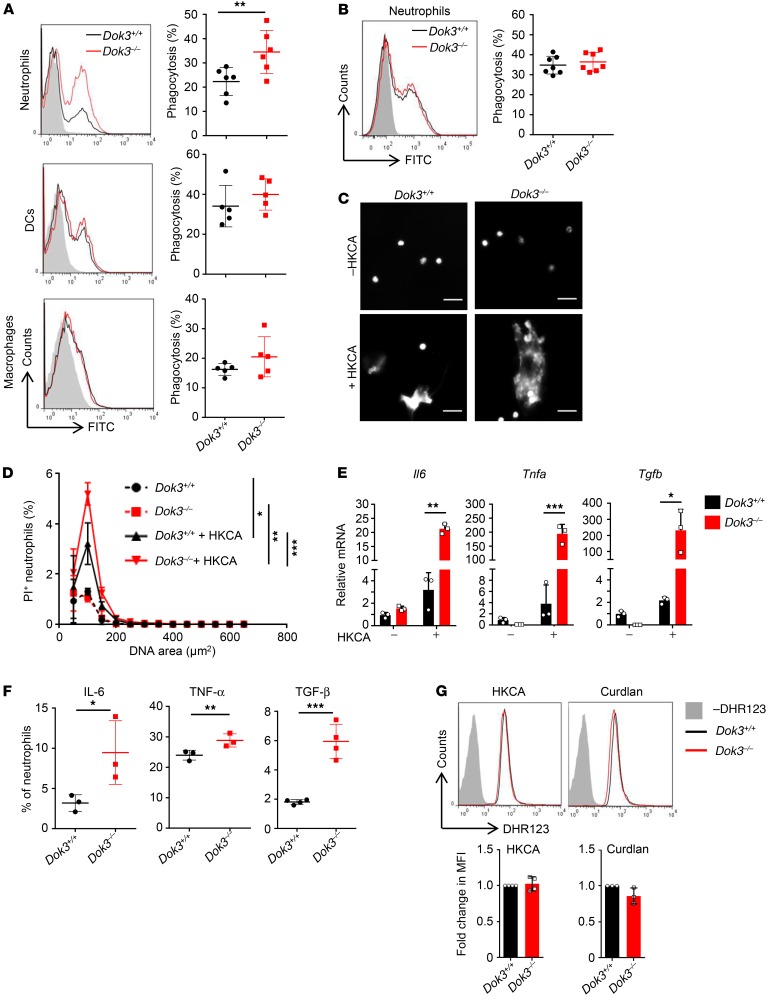
Figure 3. Enhanced antifungal effector functions of Dok3–/– neutrophils.
(A and B) Phagocytosis of FITC-labeled (A) unopsonized or (B) opsonized HKCA by bone marrow neutrophils, splenic DCs, and macrophages (MOI 1:2). Gray histogram represents unstimulated control. Symbols represent individual mice (n = 5–7). Data are shown as mean ± SD. **P = 0.01, unpaired 2-tailed Student’s t test. (C and D) NET release after stimulation of purified Dok3+/+ and Dok3–/– neutrophils with hyphae form HKCA (MOI 1:10). (C) Extracellular DNA stained with DAPI 4 hours following stimulation. Scale bars: 20 μm. (D) Quantification of NET release with PI. Percentage of PI+ neutrophils over total number of neutrophils. *P = 0.0003; **P = 0.0001; ***P = 0.0001, 2-way ANOVA, Sidak’s multiple-comparison post test. Data are pooled from 3 independent experiments (n = 3). (E) mRNA expression levels of indicated cytokines in purified Dok3+/+ and Dok3–/– neutrophils after stimulation with HKCA (MOI 1:2). Data are shown as mean ± SD. (n = 3). *P = 0.03; **P = 0.0002; ***P = 0.0006, unpaired 2-tailed Student’s t test. (F) Flow cytometric analysis of indicated cytokine production by Dok3+/+ and Dok3–/– neutrophils following zymosan stimulation. Representative dot plots are shown in Supplemental Figure 3. Graph indicates percentages of IL-6+, TNF-α+ and TGF-β+ neutrophils. Data are pooled from 3 independent experiments (n = 3–4). Data are shown as mean ± SD. *P = 0.05; **P = 0.009; ***P = 0.0004, unpaired 2-tailed Student’s t test. (G) ROS production by Dok3+/+ and Dok3–/– neutrophils. Neutrophils were labeled with DHR123 before stimulation with HKCA (MOI 1:2) (n = 4) or curdlan (100 μg/ml) (n = 3). Fluorescence was measured by flow cytometry. Histograms were pregated on singlet, live Ly6G+Ly6C+ cells. Gray histograms represent unlabeled control. One representative experiment out of 3 independent experiments is shown. Bar graphs indicate fold change in MFI of DHR123 fluorescence in Dok3–/– neutrophils relative to Dok3+/+ neutrophils. Data are pooled from 3 independent experiments. Data are shown as mean ± SD.

