. 2019 Jun 18;8:e45421. doi: 10.7554/eLife.45421

Figure 3. Plasma membrane localization is required for VRAC activation.

(A) Scheme depicting the different subcellular localizations of VRACs using the reverse aggregation system. Upon addition of the D/D solubilizer, VRACs carrying FM dimerization domains disaggregate in the ER and travel through the Golgi complex to the plasma membrane. Indicated time points were deduced from experiments shown in (B) and (Figure 3—video 1). (B) Still images of HeLa cells expressing LRRC8A-CFP-FM2 and GalNAcT2-RFP as Golgi marker from Figure 3—video 1 at time points indicated in (A). Scale bar, 20 µm. (C) cFRET measured in HeLa cells expressing A-CFP-FM2/E-YFP. VRACs localizing to the ER (n = 4, 10 cells), Golgi (n = 5, 26 cells) and plasma membrane (PM; n = 5, 11 cells) were measured at 10, 80 and 165 min after addition of D/D solubilizer. Data in time traces represent mean ± s.d. Right: average normalized cFRET in of the first seven time points in isotonic and last three time points in hypotonic buffer. Data represent individual cells (ER, PM) or FOVs (Golgi) and mean ± s.e.m. Statistics: ***p<0.0005; n.s., not significant, Student’s t-test, comparing hypotonic with isotonic.

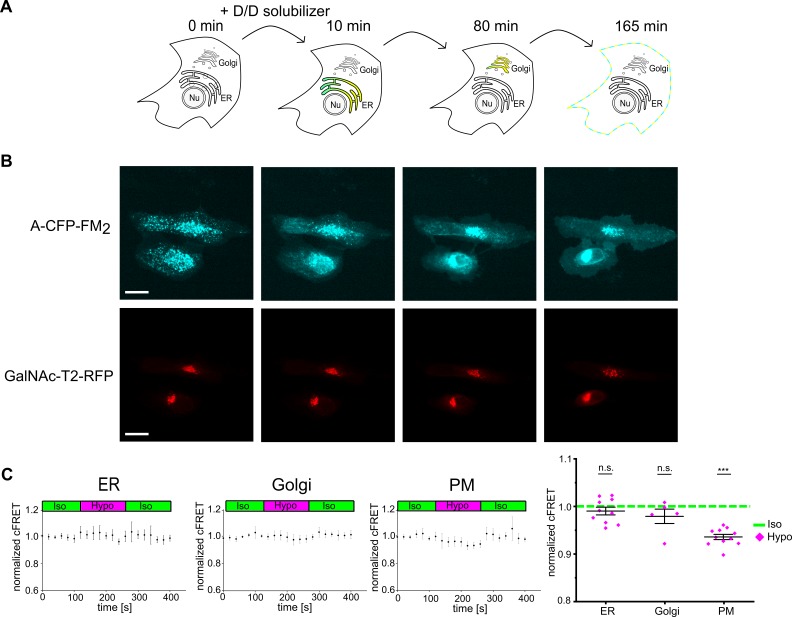
Figure 3—source data 1. Statistics of hypotonicity-induced FRET changes and cholesterol depletion.
The statistics in the Tables accompany data in Figure 3C, Figure 3—figure supplement 2B and C. Normalized cFRET (Figure 3C).
DOI: 10.7554/eLife.45421.012

Figure 3.

Figure 3—figure supplement 1. Trafficking of LRRC8 complexes through the secretory pathway.

Figure 3—figure supplement 1.

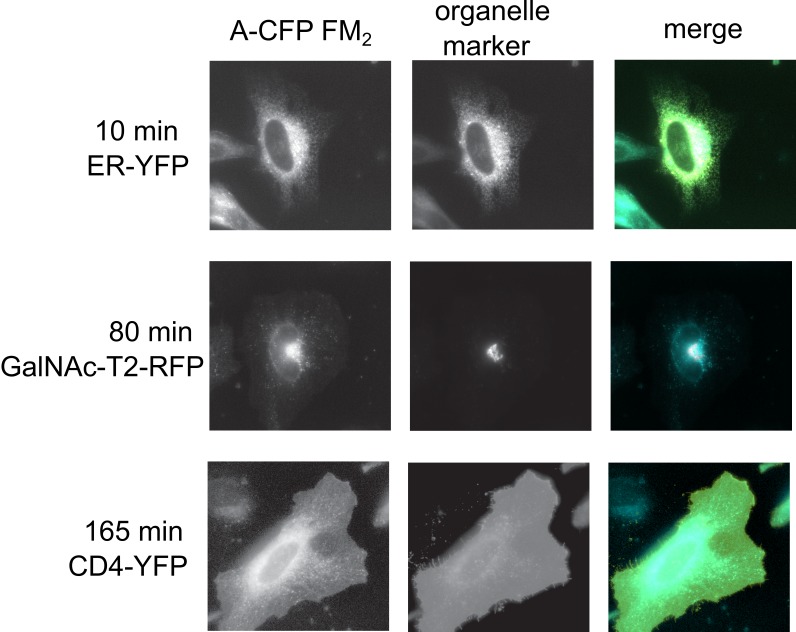
Representative fluorescence images of HeLa cells co-expressing LRRC8A-CFP-FM2 (left, cyan in merge) and organelle markers (middle) ER-YFP (top, yellow in merge), GalNAcT2-RFP (middle, red in merge) and CD4-YFP (bottom, yellow in merge) at indicated time points after addition of D/D solubilizer.
Figure 3—figure supplement 2. Modulation of VRAC activity by the actin cytoskeleton and cholesterol content.

Figure 3—figure supplement 2.

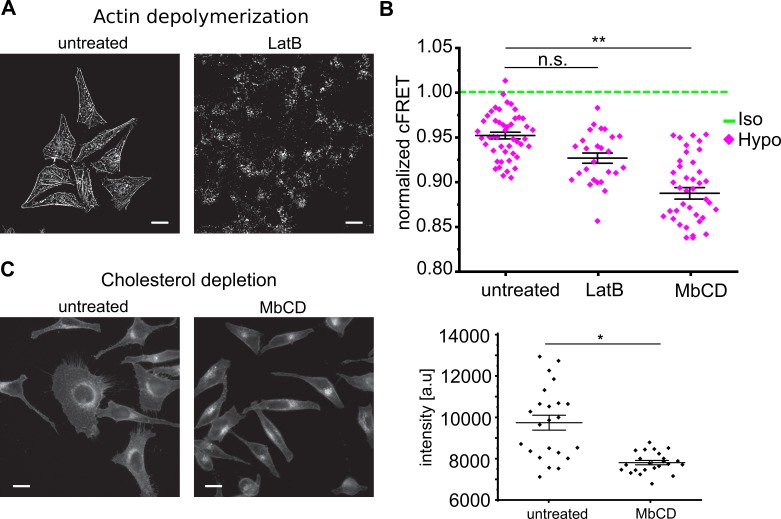
(A) Representative fluorescence images of control HeLa cells treated with 2 µM latrunculin B (LatB) or not (untreated) that were fixed and stained with Alexa Fluor 546-phalloidin. Image of untreated cells was deconvolved using the blind-algorithm package of LAS X. (B) Comparison of cFRET in isotonic and hypotonic buffer of HeLa cells expressing A-CFP/E-YFP and treated with latrunculin B (LatB; n = 8 dishes with 26 cells) as in (A) or methyl-β-cyclodextrin (MbCD; n = 10 dishes with 46 cells) as in (C) with untreated cells (data from Figure 1E). Data represent individual cells (diamonds) and mean ± s.e.m. (C) Left: Representative fluorescence images of control HeLa cells treated with 5 mM methyl-β-cyclodextrin (MbCD) or not (untreated) that were fixed and stained with filipin. Right: filipin fluorescence intensity of untreated and MbCD-treated HeLa cells. n = 5 with over 300 cells per condition, data represent individual FOVs (diamonds) and mean ± s.e.m. Scale bars, 20 µm. Statistics: *p<0.05; **p<0.005; n.s., not significant, Student’s t-test.
Figure 3—video 1. Trafficking of LRRC8 complexes through the secretory pathway.
Download video file (1.4MB, mp4)
DOI: 10.7554/eLife.45421.013
Top: Time-lapse of the CFP (left) and RFP (right) channels of HeLa cells expressing LRRC8A-CFP-FM2 and GalNAcT2-RFP shown in Figure 3B upon addition of D/D solubilizer. Bottom: CFP intensities were measured in regions of interest (ROI, indicated in CFP channel) for Golgi (red ROI; selected according to the GalNAcT2-RFP signal) and plasma membrane (PM, green ROI) localization.