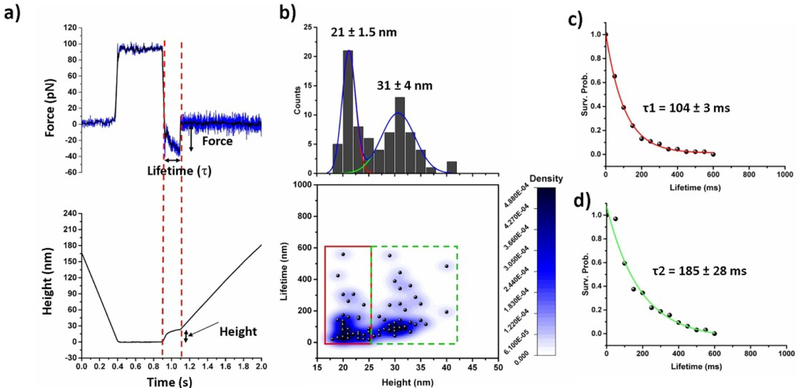
Fig. 3.
AFM force-clamp experiments; (a) shows both the force vs. time (up) and height vs. time (bellow) profile in force-clamp experiment. The black line in upper panel indicates smoothing of data by FFT method by 5 points. Two dotted red lines indicate force clamp region. Applied force, lifetime of bond and height measurements are determined from raw data as shown above. (b) Aβ42 monomer-monomer interactions under a constant clamping force of 30 pN; 2D Kernel density plot showing correlation of the position (height) and lifetime of Aβ42 dimers, showing two types of populations. Height histograms are shown at the top panel, fitted with two Gausian functions. (c) and (d) Lifetime survival plots for the data indicated by red and green rectangles respectively. The data were fitted with single exponential decay functions. Lifetime value shown here as mean ± fitting error.

