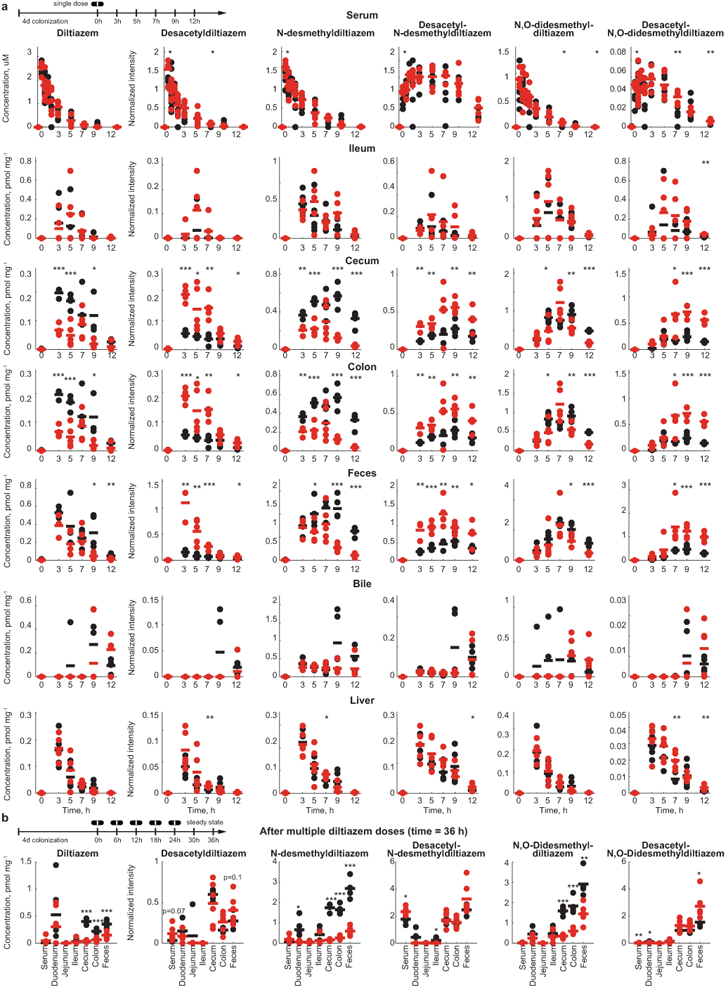
Extended Data Figure 8. bt4096-depended in vivo diltiazem metabolism.

a, Diltiazem and diltiazem metabolite kinetics in different tissues following a single oral dose of diltiazem in gnotobiotic mice mono-colonized with either B. thetaiotaomicron wildtype or the bt4096 mutant strain. b, Intestinal diltiazem and diltiazem metabolite levels following multiple oral doses of diltiazem in mice mono-colonized with either B. thetaiotaomicron wildtype or the bt4096 mutant strain. Five oral doses were administrated to animals in six hour intervals. Tissues were collected 12 hours after the last oral dose of diltiazem. For all mouse experiments: Horizontal lines show the mean of n=5 animals and times reflect hours after oral diltiazem administration. * p ≤ 0.05, ** ≤ 0.01, *** ≤ 0.001 (unpaired two-sided Student’s t-test with FDR correction for multiple hypotheses testing). Data and p-values are provided in Supplementary Tables 10-11.
