
Extended Data Figure 1. Setup of drug assay, characterization of tested drugs, and summary of metabolic bacteria-drug interactions.
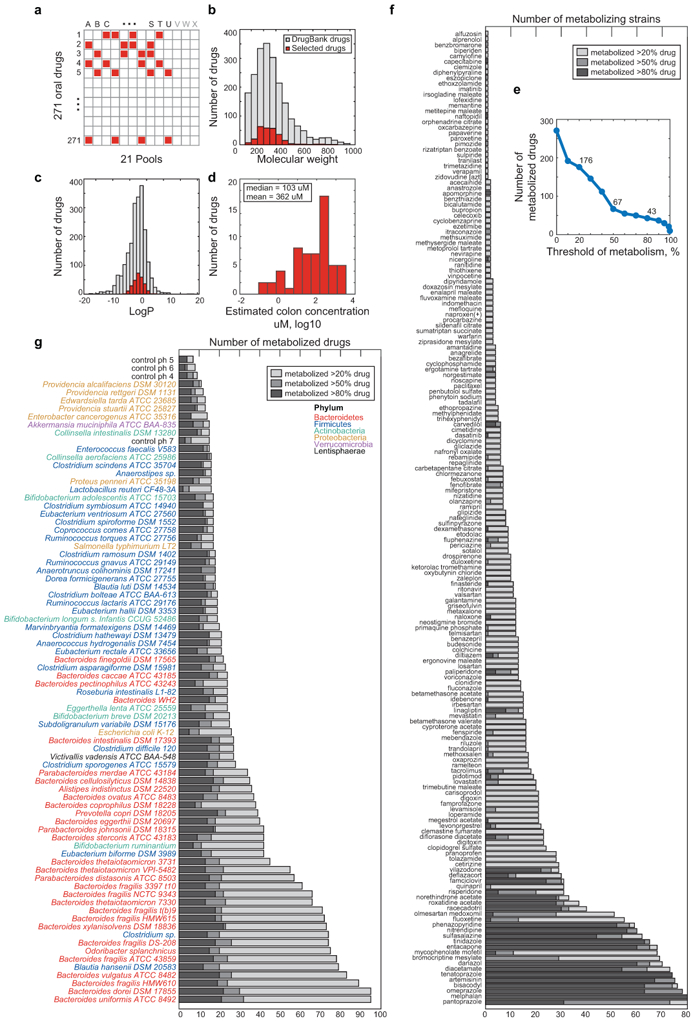
a, Schematic representation of combinatorial pooling scheme using 21 drug pools (A-U) and 3 non-drug controls (V-X). Each of the 271 drugs is tested in quadruplicate (present in 4 pools) and any two drugs are tested in the same pool at most twice (Supplementary Table 2). b-c, Molecular weight (b) and LogP (c) distribution of 271 tested drugs (red) in comparison with 2099 clinically approved drugs (DrugBank31). d, Distribution of predicted colon drug concentration for 58 of the 271 drugs tested (data from Maier et al.17). The predicted median and mean concentration in the large intestine for these compounds is 103 uM and 362 uM, respectively, when each drug is administered at its standard oral dose. e, Number of drugs metabolized as a function of the selection threshold (metabolized fraction). f, Number of gut bacteria that metabolize a given drug. g, Number of drugs metabolized by each bacterial strain.