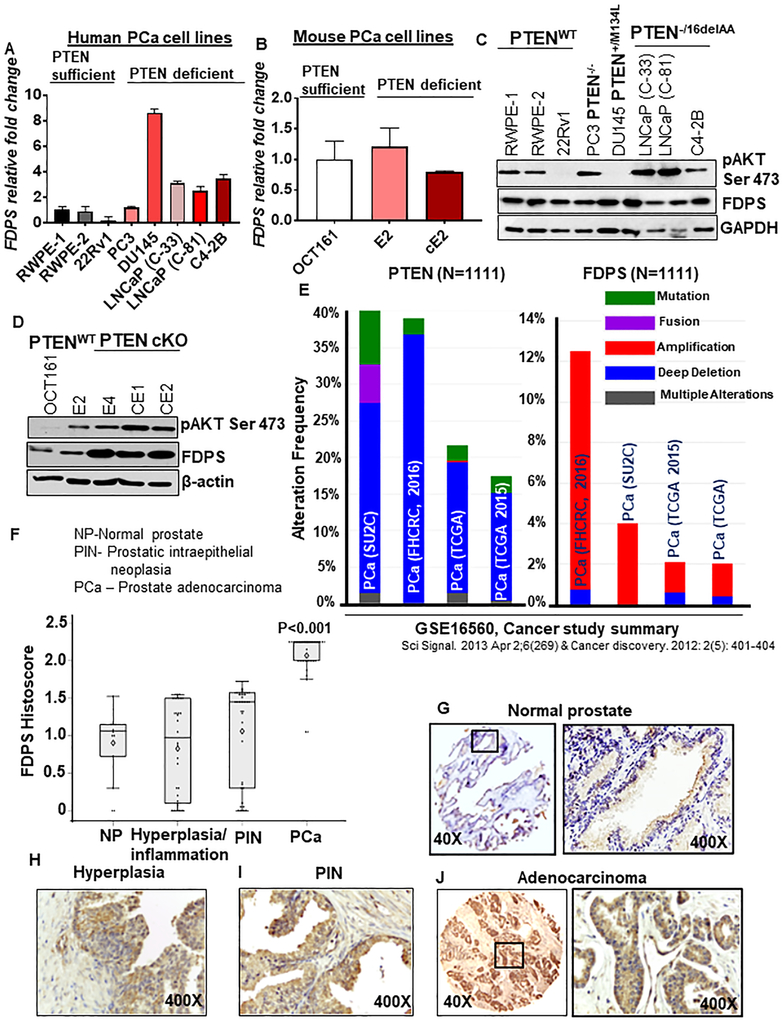
Fig. 2.
FDPS is differentially regulated in prostate adenocarcinoma and PTEN-deficient human and murine prostate cancer cells as compared to respective normal tissues/PTENWT counterparts. a-d FDPS mRNA and protein expression were screened in a panel of human and mouse prostate cancer cell lines differing by PTEN mutation/deletion status. Total RNA was isolated from indicated human and mouse normal and prostate cancer cells lines and subjected to semi-quantitative RT-PCR. a Relative fold change of FDPS expression in a normal immortalized prostate epithelial cell line and a panel of prostate cancer cell lines was normalized with the Ct value of GAPDH. The error bar represents the average of triplicate samples. b FDPS relative mRNA expression was analyzed by semi-quantitative RT-PCR in normal prostate-derived cells and PTEN cKO mouse-derived syngeneic cell lines. c, d Western blot analysis of FDPS and phosphorylated AKT expression in a panel of human and mouse prostate cancer cell lines. e Bar graph showing concordance of FDPS gene amplification and PTEN deletion/mutation status in same PCa cohorts using CBioportal. f Box plot shows a significant increase in the mean FDPS intensity in prostate adenocarcinoma tissues and PIN lesions compared to hyperplasia and normal prostate tissues (P<0.001). g-j Images represent FDPS immunohistochemical staining in prostate tissues, g normal prostate, h hyperplasia, i PIN and j prostate adenocarcinoma.

