Fig. 6.
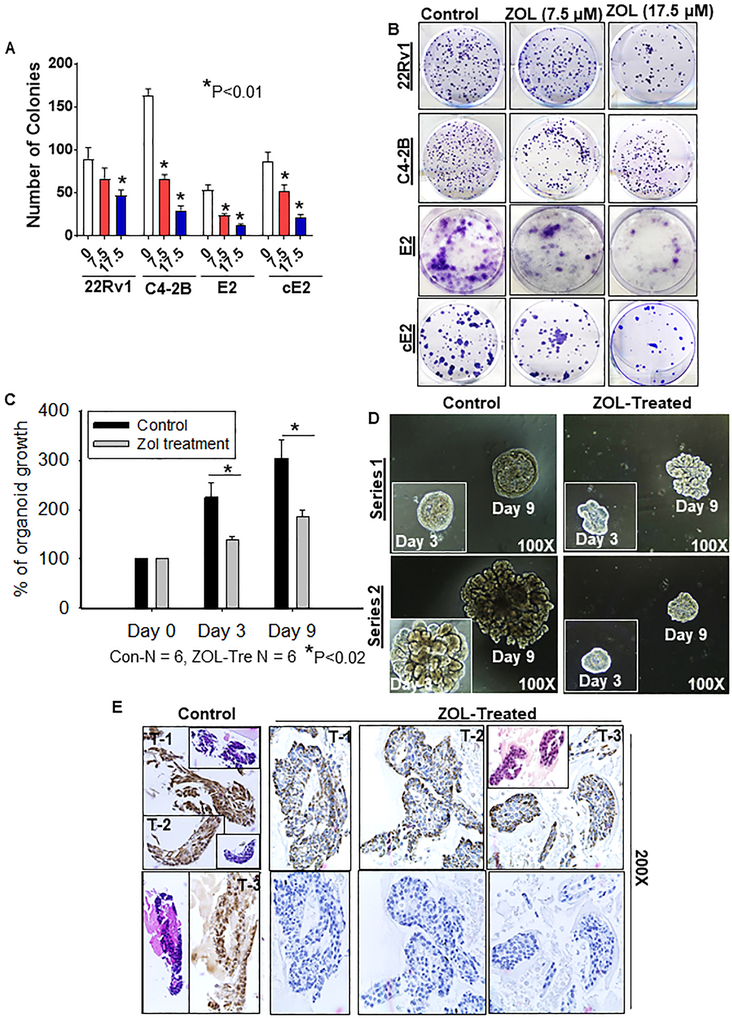
Effects of ZOL in 2D and 3D tumoroid in vitro models. a Colony formation assay was performed in human and mouse PCa cells. PTEN-deficient C4-2B, E2 and cE2 and PTEN sufficient 22Rv1 cells were treated with and without ZOL (N=3/treatment group) at indicated concentrations for 24 hr. After 14 days of incubation in complete medium, colonies were fixed with methanol, stained with crystal violet and counted. Colony counts are expressed relative to untreated controls. Bar graphs represent data as mean ± SE of triplicates. P values are denoted by asterisks (P< 0.01). b Representative images showing colonies formed by human and mouse PCa cells treated with and without ZOL. c The bar graph depicts average tumoroid growth with and without (control) ZOL treatment. d Light microscope images of representative tumoroids treated with and without ZOL on days 0, 3 and 9. e H&E (Insert) and FDPS staining analysis on the tumoroids treated with and without ZOL.

