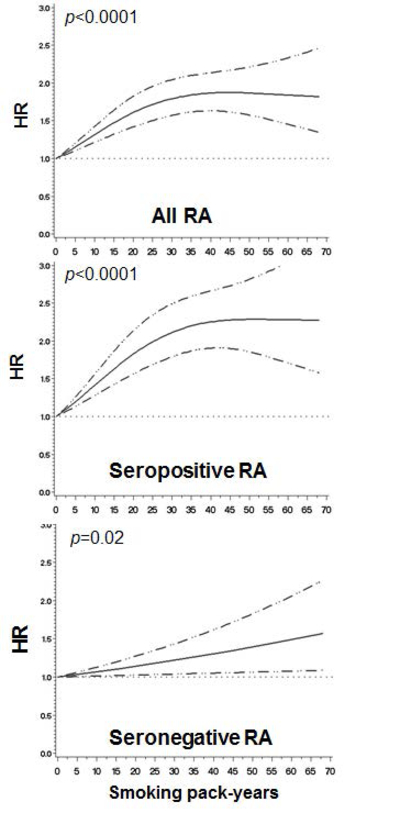
Figure 1.

Among all women (reference: 0 pack-years), restricted cubic spline curves showing hazard ratios and 95% confidence bounds for rheumatoid arthritis serologic phenotypes by smoking pack-years. P values are for trend. Curves are adjusted for the covariates listed in Table 2. See Supplemental Table 2 for analysis by categories of smoking pack-years.
