
Figure 1. Flow diagram describing the main components of computational radiomics pipeline in Computational Environment for Radiological Research (CERR).
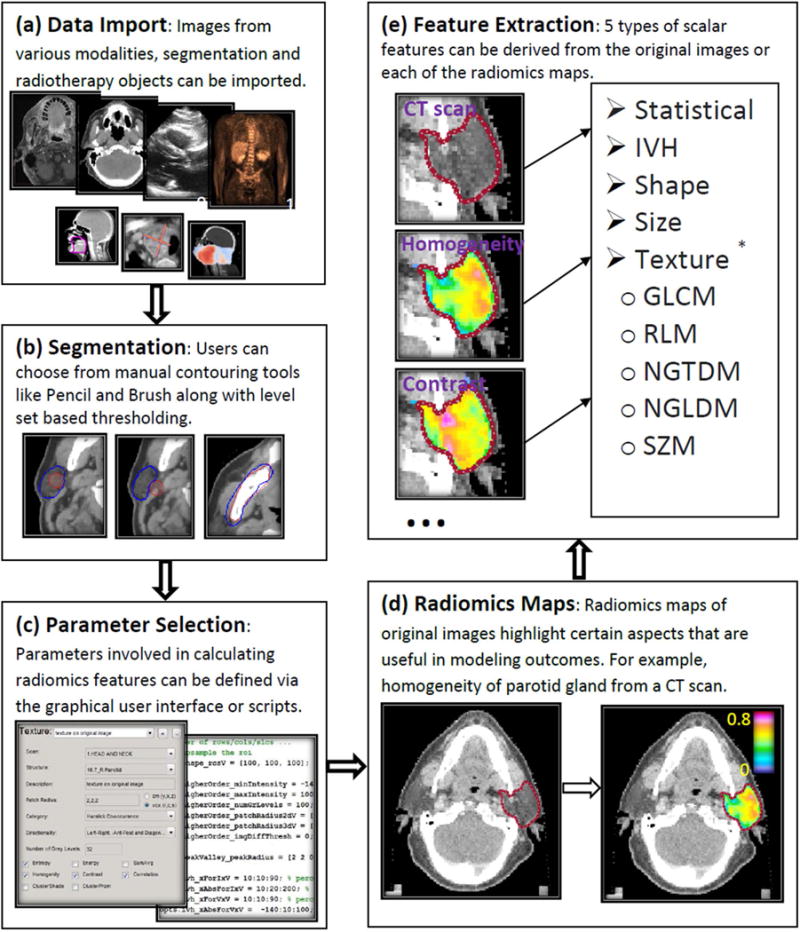
The pipeline consists of (a) data import, (b) segmentation, (c) parameter selection, (d) radiomics map/pre-processing filters, and (e) extraction of scalar radiomics features for further analysis.
* Texture radiomics scalars based on gray level co-occurrence matrix: Gray level co-occurrence (16), Neighborhood gray-tone difference (20), Neighborhood gray-level dependence (21), Run length (22), and Size zone (23) matrices.