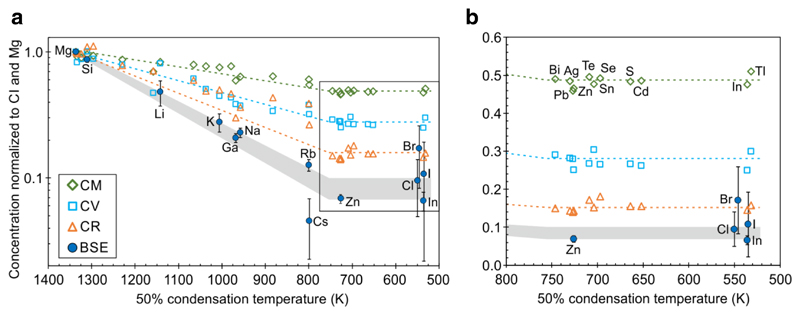
Figure 1. Volatile element depletion pattern for different carbonaceous chondrite groups and the bulk silicate Earth (BSE).
(a) CI chondrite and Mg normalized volatile element abundances in carbonaceous chondrites and lithophile volatile element abundances in the BSE define a hockey stick depletion pattern in a semilog plot. (b) Zoom-in on plateau region of the hockey stick. Error bars represent the propagated uncertainties of CI chondrite and CM, CV, CR or BSE concentrations, respectively. For data sources see Supplementary Table 1.

