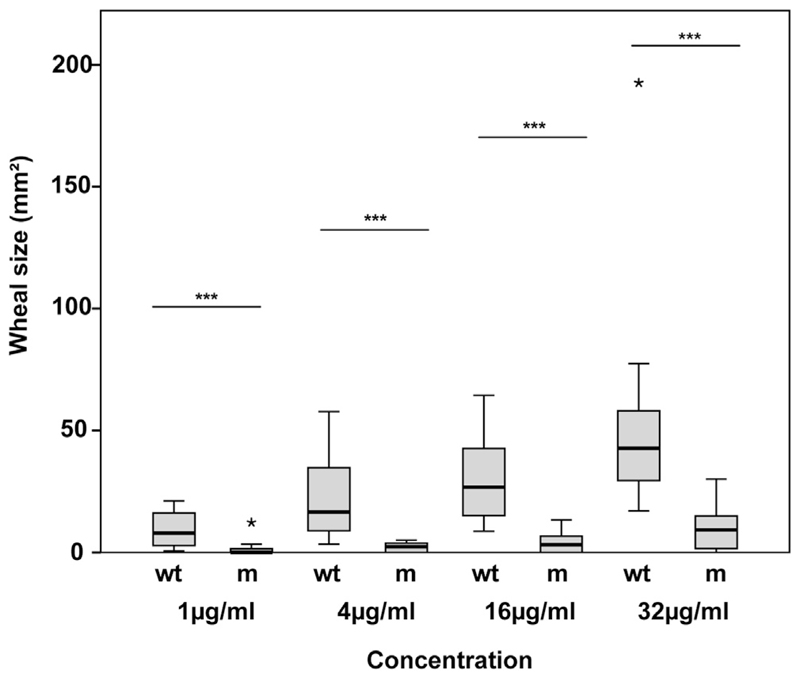
Fig 1.
Reduced allergenic activity of mCyp c 1 compared with wtCyp c 1 demonstrated by means of skin testing of patients with fish allergy. Twelve patients were pricked with increasing concentrations (x-axis: 1, 4, 16, and 32 μg/mL) of wtCyp c 1 (wt) and mCyp c 1 (m). Displayed are box plots representing wheal areas (y-axis: millimeter squared) for patients, with medians indicated by horizontal lines and outliers represented by asterisks (*). Significant differences (***P < .001) between wtCyp c 1 and mCyp c 1 are displayed for each tested concentration.

