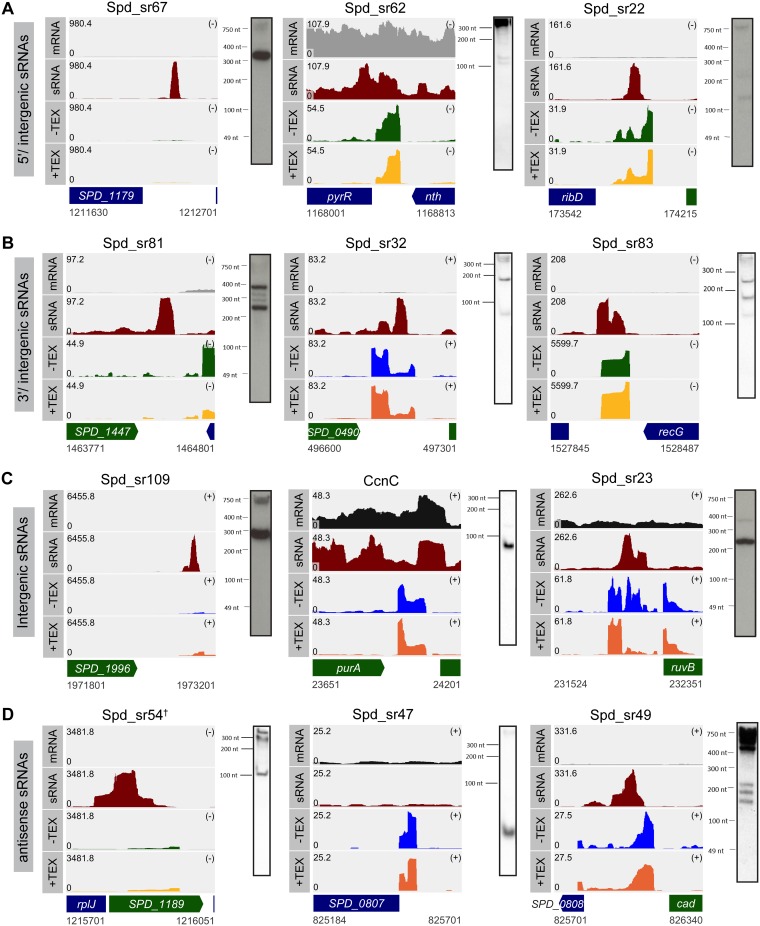
FIG 2.
Examples of sRNAs transcribed from different genetic contexts in D39W. Shown are read coverage maps of sRNAs identified in each of the following categories: 5′/intergenic (A), 3′/intergenic (B), intergenic (C), and antisense (D). The left panels show examples of sRNAs that were identified only by sRNA-seq. The middle panels show examples of sRNAs that were identified only by dRNA-seq, and the right panels show examples of sRNAs that were identified by both sRNA-seq and dRNA-seq analyses. The corresponding Northern blots for the each sRNA identified by RNA-seq analysis are shown. Tracks labeled mRNA, sRNA, −TEX, and +TEX correspond to the read coverages for the sRNAs and their flanking regions in the wild-type (WT) strain that were obtained from mRNA-seq, sRNA-seq, and mock-treated and TEX-treated dRNA-seq samples, respectively. Coverage represents depth per million reads (mRNA and sRNA) of paired-end fragments (−TEX and +TEX) and was averaged between normalized replicates (see Materials and Methods). In each coverage graph, ORFs encoded on the plus and the minus strands are color-coded in green and blue, respectively. † indicates that the sRNA can also be detected by dRNA-seq analysis, but the read coverage obtained for Spd-sr54 by sRNA-seq analysis is >10-fold higher than that obtained by dRNA-seq analysis. Probes used are listed in Table S5 in the supplemental material.

