FIG 3.
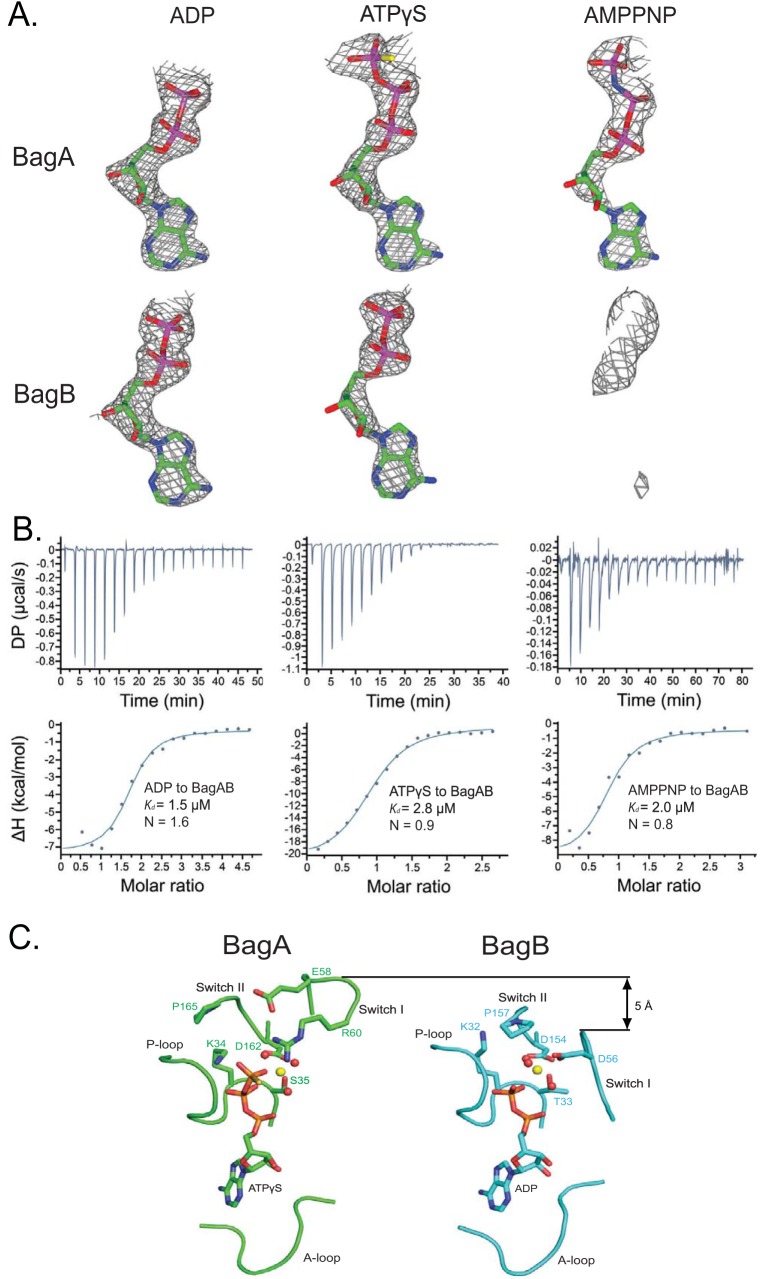
The nucleotide-binding sites in BagA and BagB are not equivalent. (A) Simulated-annealing omit maps of cocrystals with ADP (left), ATPγS (middle), and AMP-PNP (right) in BagA (upper panel) and BagB (lower panel) displayed at a threshold of 2.5σ. Atomic models of the observed nucleotides are shown as sticks. (B) In vitro binding of ADP (left), ATPγS (middle), and AMP-PNP (right) to BagAB as measured by ITC at 25°C. (C) The nucleotide-binding sites of BagA (left) and BagB (right) in the structure determined in the presence of ATPγS. The A-loop, P-loop, switch I region, and switch II region are shown as Cα trace. The nucleotides are shown as sticks. Mg2+ and water are shown as yellow and red spheres, respectively.

