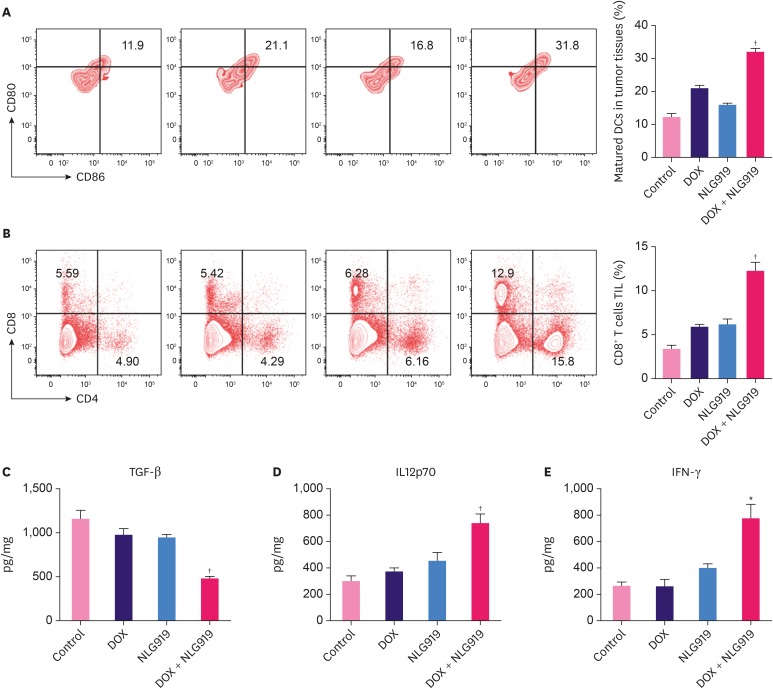
Figure 5. Flow cytometry analysis of immune cell subsets and ELISA analysis of cytokine expression in tumor tissues. (A) Flow cytometry gating and histogram analysis of mature DCs in the tumor tissues at the end of treatment. The mature DCs were denoted as CD80+CD86+ populations (gate in CD45+CD11b+CD11c+ cell population). (B) Flow cytometry gating and histogram analysis of cytotoxic T cells (CD8+ T cells) in the CD45+ TILs in tumor tissues from mice receiving indicated treatment. (C-E) ELISA results of cytokine production in the tumors from mice receiving indicated treatments.
Data represent means ± standard deviation.
ELISA = enzyme-linked immunosorbent assay; DOX = doxorubicin; DC = dendritic cell; TIL = tumor infiltrating lymphocyte; TGF = transforming growth factor; IL = interleukin; IFN = interferon.
*p < 0.05; †p < 0.01 (versus DOX group).

