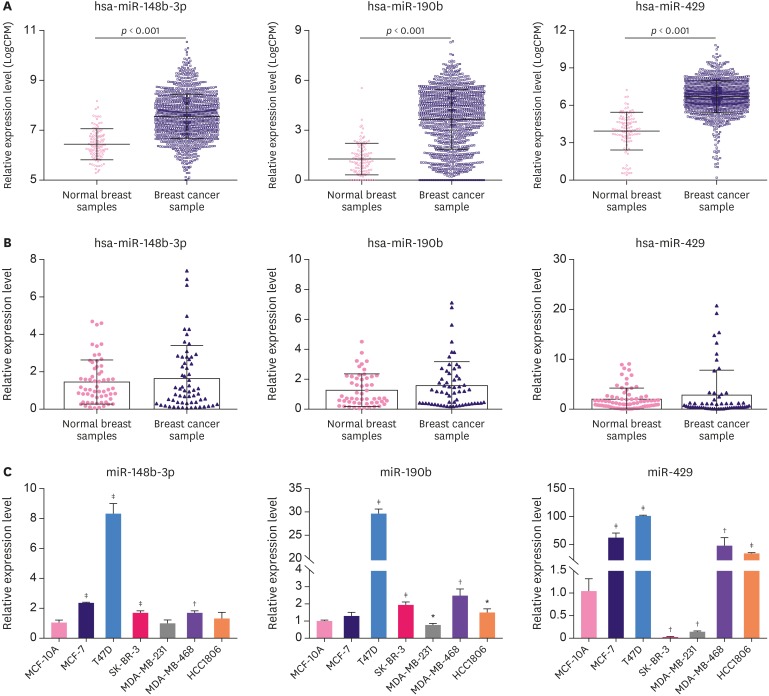
Figure 2. The expression of miR-148b-3p, miR-190b, and miR-429 was enhanced in breast cancer tissues and cell lines. (A) Expression levels of the 3 miRNAs in TCGA. (B) Expression levels of the 3 miRNAs were examined in breast cancer samples. (C) Expression levels of the 3 miRNAs were examined in 7 cell lines.
TCGA = The Cancer Genome Atlas; miRNA = microRNA.
*p < 0.05, †p < 0.01, ‡p < 0.001 vs. MCF-10A using 1-way analysis of variance.

