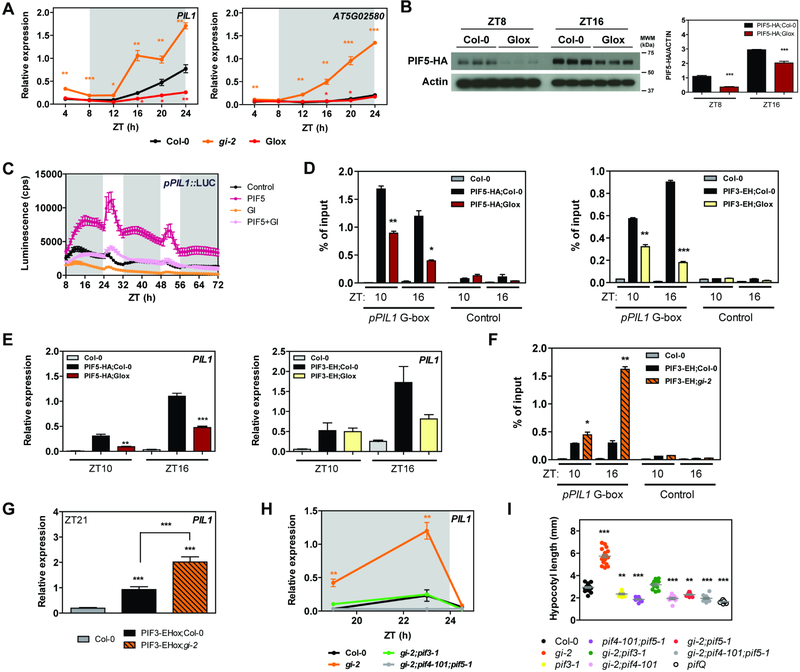
Figure 2. GI modulates PIF stability and activity.
(A) Relative expression of PIL1 and AT5G02580 in wildtype (Col-0), gi-2, and GIox seedlings grown for 10 days in SDs (mean ± SEM of 3 biological replicates). White and gray shadings represent day and night, respectively.
(B) PIF5-HA protein accumulation at ZT8 and 16 in the indicated backgrounds under SD conditions. Protein levels were normalized against ACTIN levels. The quantitation is shown on the right (mean ± SEM of 3 biological replicates).
(C) Transactivation assays in N. benthamiana leaves. Different effectors were co-expressed with the pPIL1::LUC reporter construct. Luminescence was measured 2 days post-infiltration in SD conditions. Results show mean ± SEM (n=12).
(D and F) ChIP assays of 10-day-old seedlings grown in SD conditions and harvested at the indicated ZTs. The enrichment of the specified regions in the immunoprecipitated samples was quantified by qPCR. Values represent mean ± SEM (n=2–4).
(E, G, and H) Relative expression of PIL1 in the indicated backgrounds in SDs (mean ± SEM of 3 biological replicates). White and gray shadings represent day and night, respectively.
(I) Hypocotyl length measurements from the indicated lines grown for 14 days in SDs (in gray, mean ± SEM, n=16–22).
(A-I) *p<0.05, **p<0.01, ***p<0.001 Student’s t-test (A-H) or Tukey’s multiple comparisons test (I).
See also Figures S2 and S3.

