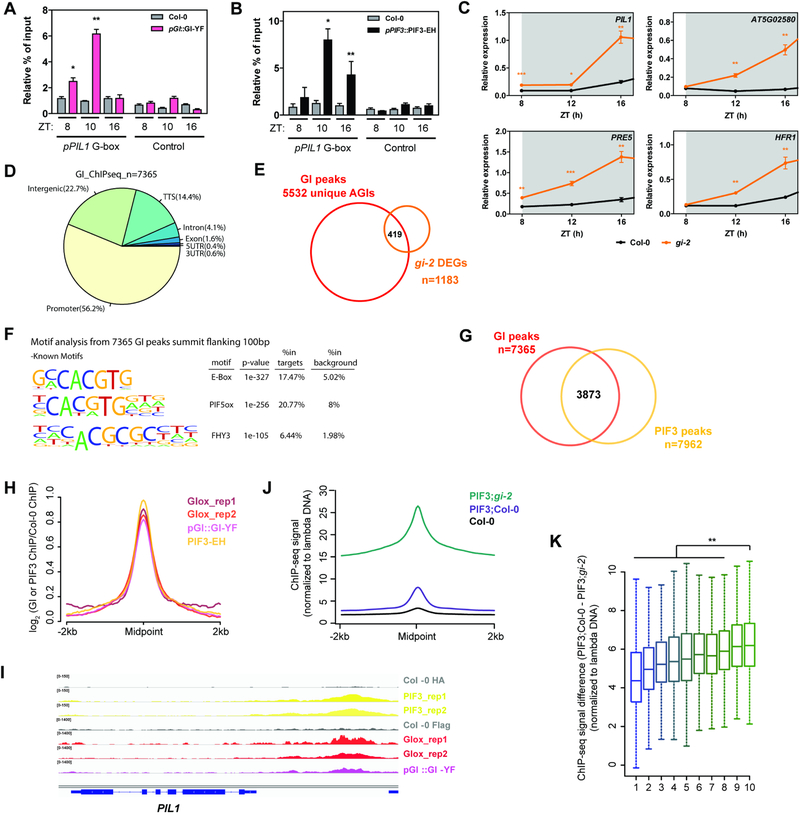
Figure 3. GI and PIFs occupy the same genomic targets in a phase dependent pattern.
(A and B) ChIP assays of 10-day-old seedlings grown in SD conditions and harvested at the indicated ZTs. The enrichment of the specified regions in the immunoprecipitated samples was quantified by qPCR. Values represent mean ± SEM of 3 independent experiments (n=2–4; *p<0.05, **p<0.01 Student’s t-test). To account for experimental noise, the enrichment in each replicate was calculated as % of input and normalized to the enrichment of pPIL1 fragments in Col-0.
(C) Relative expression of the indicated PIF targets in wildtype (Col-0) and gi-2 during early night in SDs (mean ± SEM of 3 biological replicates; *p<0.05, **p<0.01, ***p<0.001 Student’s t-test; data from Figure 2A and S2A is re-plotted). White and gray shadings represent day and night, respectively.
(D) Genomic annotation of GI ChIP-seq peaks. The midpoint of the peaks was used for this analysis.
(E) Overlap between GI ChIP-seq targets and gi-2 DEGs.
(F) Over-represented cis elements around the summit of GI ChIP-seq peaks (±100 bp flanking region).
(G) Overlap between GI and PIF3 ChIP-seq peaks (hypergeometric test p<0.01).
(H) Metaplot of the signal from PIF3 and GI ChIP-seqs plotted over the centers of PIF3 peaks.
(I) Visualization of PIF3 and GI ChIP-seq data in the genomic region encompassing the PIL1 locus.
(J) Quantitative analysis of the signal in PIF3-EH;Col-0 and PIF3-EH;gi-2 ChIP-seqs plotted over the centers of PIF3 peaks (n=7962). The ChIP-seq signal in each sample was additionally normalized to a spiked in control (unmethylated lambda DNA).
(K) Boxplot of the signal difference between quantitative PIF3-EH;Col-0 and PIF3-EH;gi-2 ChIP-seqs over GI peaks ranked by increasing signal and divided in 10 groups (deciles 1 to 10). Statistically significant differences between mean values by Welch’s two sample t-test in each decile relative to the 10th decile are shown (**p<0.01).

