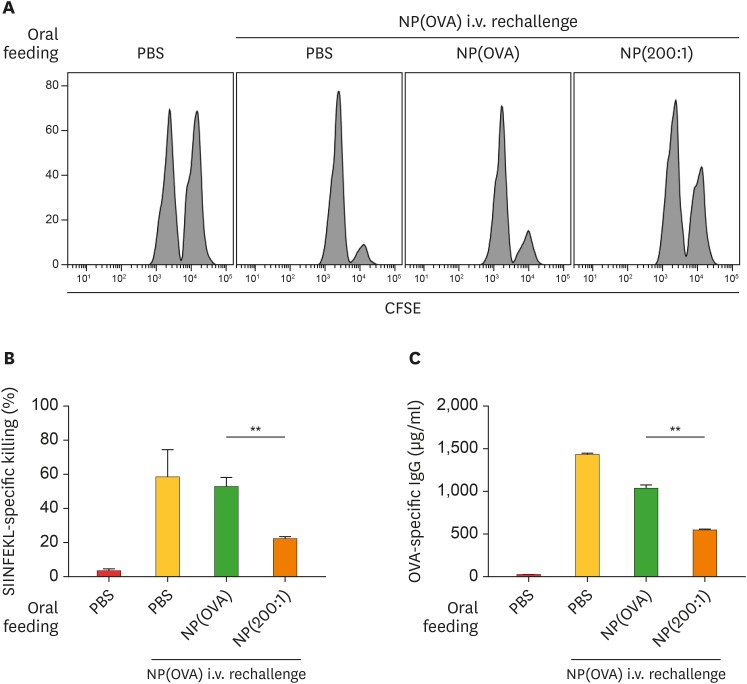
Figure 6. Effect of oral treatment of NP(OVA+aVD3) on OVA-specific responses in vivo. (A) Induction of OVA-specific CTLs. PBS, NP(OVA), or NP(200:1) (200 μg/mouse as OVA) was intragastrically injected into C57BL/6 mice on days 0 and 2. On day 9, mice were i.v. injected with NP(OVA) (80 μg/mouse as OVA). After 7 days, OVA-specific cytotoxic activity was assessed using an in vivo CTL assay, as shown in Fig. 5. The number of mice in each group was 5. (B) The proportion of killed target cells in each experimental group is shown. Data are presented as the mean±SD of 3 independent experiments. (C) Production of OVA-specific IgG. PBS, NP(OVA), or NP(200:1) (200 μg/mouse as OVA) was intragastrically injected into C57BL/6 mice on days 0 and 2. On day 9, mice were i.v. injected with NP(OVA) (80 μg/mouse as OVA). After 7 days, the sera were collected from the mice, and OVA-specific IgG levels were measured by ELISA. Data are presented as the mean±SD of 3 independent experiments.
**p<0.01.

