. 2019 Jun 24;60(7):667–678. doi: 10.3349/ymj.2019.60.7.667

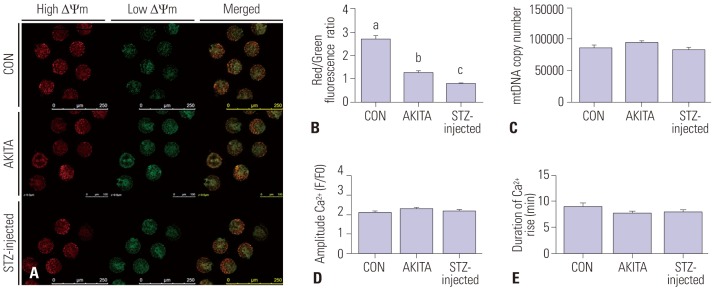
Fig. 5. Mitochondrial characteristics and exocytosis of calcium from mature oocytes. (A) A representative image of JC-1 staining of mature oocytes. Red and green indicate high and low mitochondrial membrane potential, respectively. Magnification was ×200. (B) The ratios of red/green fluorescence intensity were measured, and both diabetic mouse models had significantly lower mitochondrial membrane potential compared with controls. Different letters (a, b, c) indicate a statistically significant difference (p<0.05, n=14). (C) The quantity of mtDNA was similar between control and diabetic mouse groups (n=18). The exocytosis of calcium (D and E) was also comparable in oocytes from control and diabetic mice (n=15). STZ, streptozotocin; CON, control.

Fig. 5