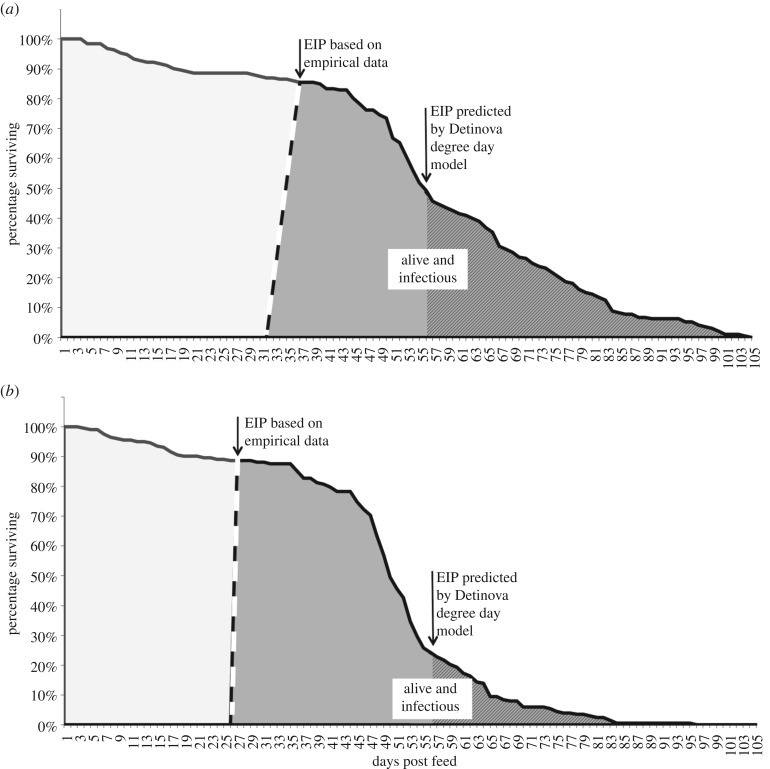
Figure 1.
Plot line shows survival of mosquitoes that we assume will become infectious following a parasite-infected blood meal. Areas under the line represent total mosquito days of life, based on empirical data for An. stephensi at (a) 18°C, and (b) 18 ± 5°C. The dashed line bounding the grey area represents estimated EIP, or parasite sporogony, based on observed data at these temperatures. The grey area represents the number of infectious-mosquito-days, which provides a relative measure of force of infection. Within the larger grey area, the hatched shading represents infectious-mosquito-days calculated using the degree-day model of Detinova [9].

