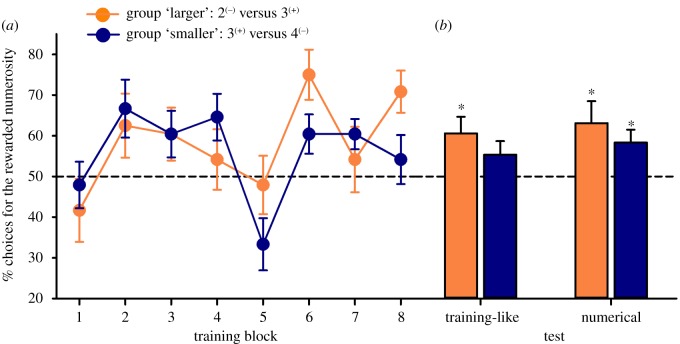
Figure 2.
Learning and test performance. (a) Learning curves of the groups 2 versus 3 (‘larger’; orange (light) symbols and bars) and 3 versus 4 (‘smaller’; blue (dark) symbols and bars), which were both rewarded for choosing 3. Data shown are means ± s.e.m. presented as blocks of four trials. Bees trained to discriminate 3 from 2 increased their correct choices from the first to the last block of four trials (two-sample t-test: t11 = 3.19, p = 0.009). This was not the case for the group of bees trained to discriminate 3 from 4 (t11 = 0.64, p = 0.54). (b) Performance during the learning test (same numerosities as those experienced during training but displayed through new stimuli) and the numerical test (the rewarded 3 numerosity versus 4 for the ‘larger’ group and versus 2 for the ‘smaller’ group). Data shown are means ± s.e.m. n.s.: non-significant; *p < 0.05. (Online version in colour.)

