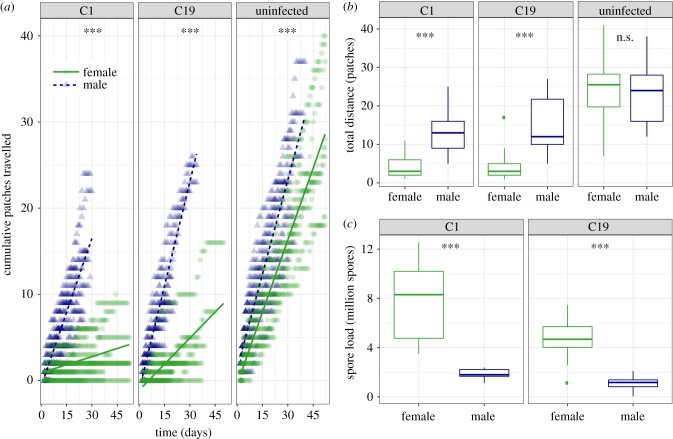
Figure 2.
Individual dispersal in interconnected microcosms. (a) The accumulated number of patches moved over time for male (blue triangles and dashed line) and female (green circles and solid line) Daphnia, infected with pathogen C1, C19 and uninfected. Coloured dots represent individual replicates and solid lines a fitted linear model. (b) Total distance (number of patches). (c) Pathogen spore load (millions) at death. Post hoc tests for difference between males and females in slope (a) or traits (b, c) are indicated at the top of each panel (ns. p > 0.05, *p < 0.05, **p < 0.01, ***p < 0.001).

