Figure 5.
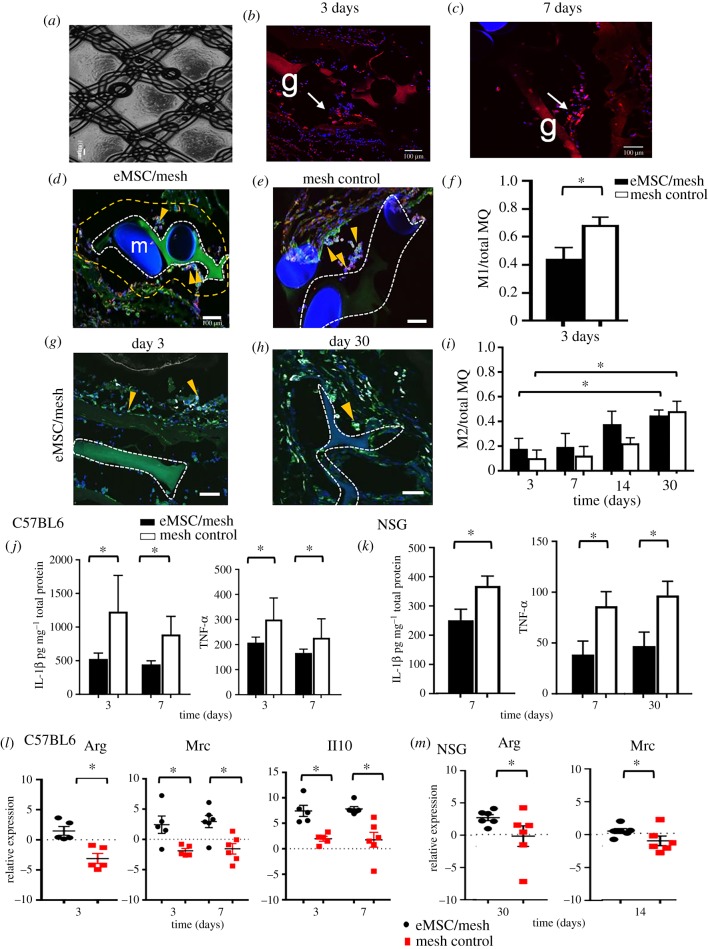
Endometrial MSC transduction and survival on the PA+G mesh in NSG mice. (a) Polyamide/gelatin (PA/G) mesh seeded and cultured with mCherry transduced eMSC. (b) mCherry labelled eMSC survived 3 and (c) 7 days post implantation. Immune response to PA/G mesh seeded with eMSC. (d,e) CCR7 M1 macrophages (red) co-localized (yellow) with the pan F4/80 macrophage marker (green) around implanted mesh in mesh/eMSC and mesh control groups in C57BL6 mice. (f) The ratio of M1 macrophages to total macrophages (MQ) in the first 100 µm increment around mesh filaments 3 days post implantation in C57BL6 mice. (g,h) CD206 M2 macrophage (white) co-localized with the pan macrophage F4/80 marker (green) around implanted mesh in mesh/eMSC and mesh control groups in C57BL6 mice. (i) The ratio of M2 macrophages to total macrophages (MQ) in the first 100 µm increment around mesh filaments in C57BL6 mice. Inflammatory M1 macrophage cytokine secretion. (j,k) IL-1β and TNF-α secretion in eMSC/mesh and mesh control group implants in (j) C57BL6 and (k) NSG mice. mRNA expression of M2 macrophage markers. (l,m) ArgI, Mrc1 and Il10 in eMSC/mesh and mesh control groups in (l) C57BL6 and (m) NSG mice. Data are mean ± s.e.m. of n = 6 animals/group. *p < 0.05. Adapted from [111]. (Online version in colour.)

