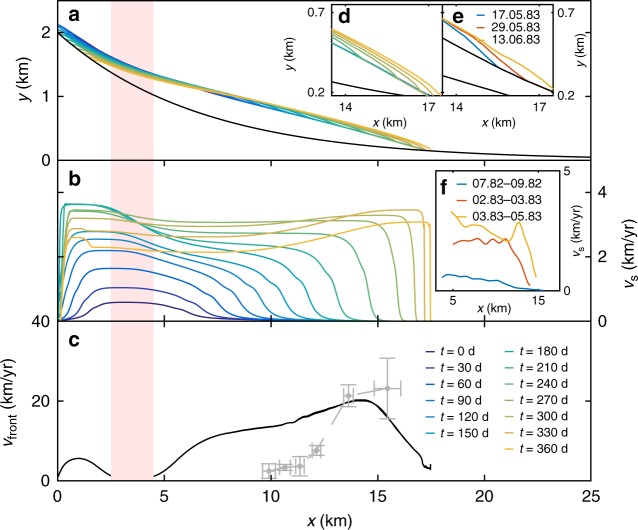
Fig. 5.
Surge propagation in the model including qualitative comparison with the Variegated Glacier surge. a Evolution of the glacier geometry with time during a surge. d Detail of the simulated geometry. e Surge front of Variegated Glacier adapted from Kamb et al.13. b Evolution of surface velocities in time. f Variegated glacier velocities from Jay-Allemand24 (the acceleration at the end of the surge is omitted). c Surge propagation speed as a function of front position downstream, dashed line shows surge propagation velocities from the Variegated Glacier. The red marker shows the trigger region. Simulation performed with dc = 1.0 m and q = 1.5

