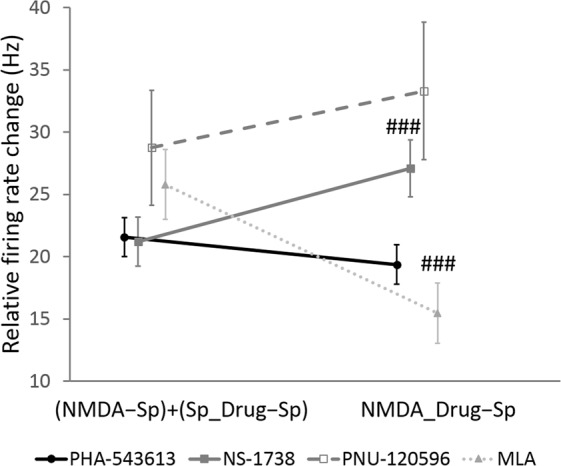
Figure 4.

Assessment of the type of interaction between NMDA and different test compounds. Data points and error bars represent mean and SEM, respectively. Sample sizes were 71, 39, 8 and 29 for PHA-543613, NS-1738, PNU-120596 and MLA, respectively. Hash symbols indicate significant difference between the summarized effect of NMDA and the given test compound during their sole administration [(NMDA − Sp) + (Sp_Drug − Sp)] and their combined effect during their co-application (NMDA_Drug − Sp) according to Wilcoxon signed rank test: ###p < 0.001.
