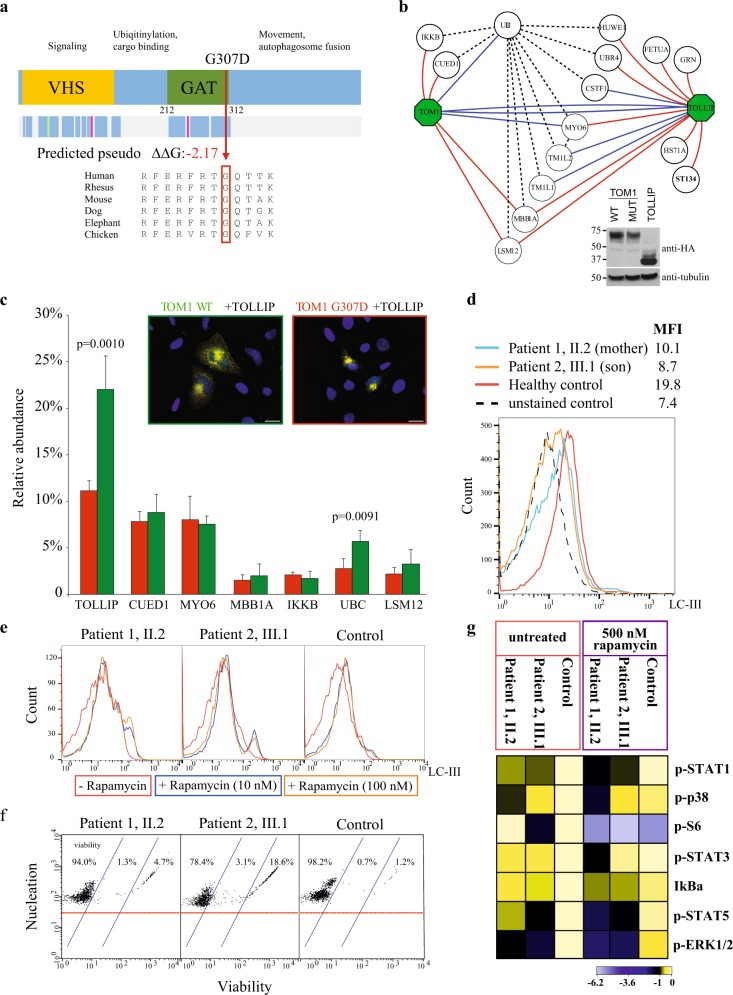
Fig. 1.
a Schematic representation of TOM1 and the observed mutation in the GAT (GGA and Tom1) domain. Mutated G307 residue and its evolutionary conservation is shown together with predicted reduced stability (predicted pseudo ΔΔG). b The AP-MS analysis of TOM1 wild type (WT), G307D mutant and TOLLIP WT confirmed reciprocally the known interactions of TOM1 and TOLLIP (blue edges) as well as identified several novel (red) interactions. The black dashed line indicates known prey-to-prey interactions. Inset: expression of all the constructs was confirmed with western blotting using anti-HA antibody. Tubulin was used as a loading control. Blots derive from the same experiment and they were processed in parallel. c The quantitative interactome analysis of TOM1 WT (green) and G307D mutant (red) showed significantly decreased binding of the G307D with polyubiquitin-C (UBC) and TOLLIP compared to the WT. Error bars indicate standard deviation. The p-values were calculated using Student’s t-test. Inset: TOLLIP efficiently recruits TOM1 WT (left) to early endosomes while recruitment of G307D (right) is hampered. HeLa cells were co-transfected with Myc-tagged WT or G307D TOM1 (green and red rectangle, respectively) and HA-tagged TOLLIP. Merged images are shown, where scale bar represents 20 μm. d Diminished LC3 staining of patient PBMCs indicates decreased autophagy. Son (III.1) is indicated with orange, mother (II.2) with blue, and control with red solid line. Interestingly, ~50% of son’s lymphocytes overlapped with the unstained control population (black dashed line). MFI, mean fluorescence intensity. e Rapamycin fails to induce autophagy in PBMCs. Line colors indicate rapamycin concentrations. f PBMCs show elevated numbers of apoptotic and dead cells in both patients. g Intracellular signaling network responses in patient skin fibroblasts reveals alterations of key pathway components phosphorylation levels at basal state and after rapamycin treatment. Heat map shows the calculated Log2 ratios of medians of panel/channel values relative to untreated control. Analyzed phosphoepitopes were STAT1 (anti-pTyr701), p38 (anti-pThr180/pTyr192), S6 (anti-pSer235/pSer236), STAT3 (anti-pTyr705), STAT5 (anti-pTyr694), and ERK1/2 (anti-pThr202/pTyr204)

