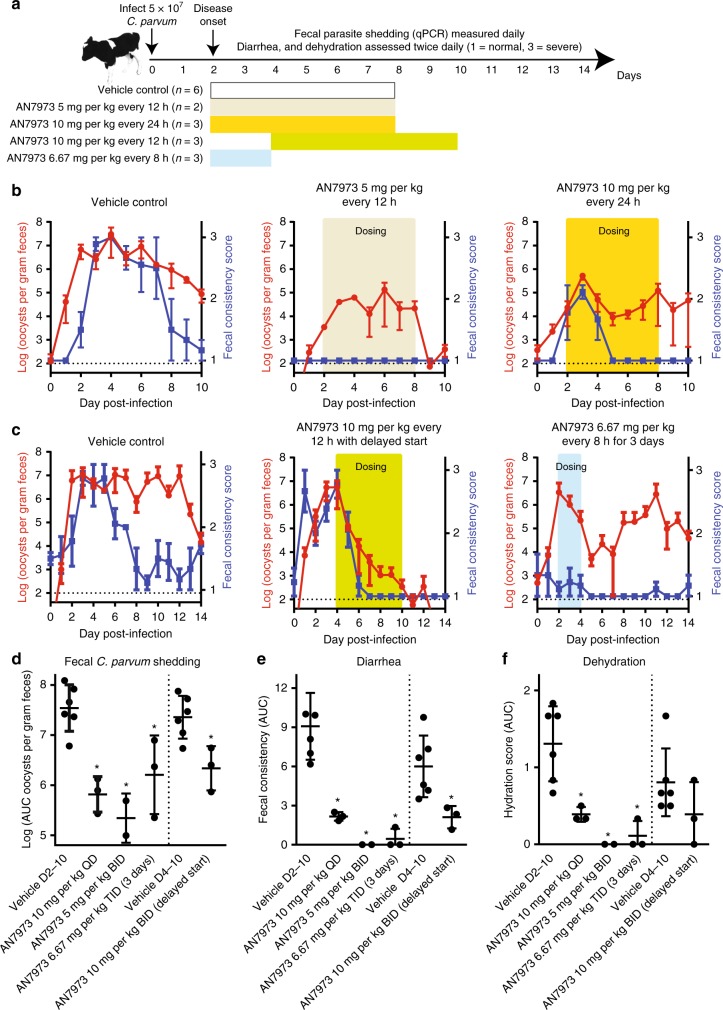
Fig. 5.
Efficacy of AN7973 in a neonatal calf model of cryptosporidiosis. a Summary of calf model and AN7973 microbiologic and clinical efficacy studies conducted. Bull Holstein calves were challenged within 48 h of birth by oral administration of ∼5 × 10⁷ C. parvum (Bunch Grass Farms Iowa isolate) oocysts. Fecal oocyst shedding was quantified daily using qPCR, and clinical assessments were conducted two times daily and quantified on a scale of 1 to 3 (1 = normal, 3 = severely abnormal (e.g., severe diarrhea, or severe dehydration)). Treatments were given at the times highlighted in color in a to c, using the following dosing regimens: no color (vehicle control given on days 2–8); tan (AN7973 5 mg per kg every 12 h on days 2–8); yellow (AN7973 10 mg per kg every 24 h on days 2–8); green (AN7973 10 mg per kg every 12 h on days 4–10); and blue (AN7973 6.67 mg per kg every 8 h on days 2–4). b Initial AN7973 calf study. Each graph shows the mean and SEM of fecal oocyst shedding (red) or diarrhea score (blue) vs. time for the indicated treatment regimen (n = 3 calves per experimental group, except for n = 2 for the 5 mg per kg group). Dotted horizontal lines indicate the approximate limit of detection for the qPCR assay. c Follow-up AN7973 calf study, demonstrating clinical and microbiologic efficacy with delayed administration. A 3-day course was effective for diarrhea, but was followed by a relapse of shedding. Each graph shows the mean and SEM of fecal oocyst shedding (red) or diarrhea score (blue) vs. time (n = 3 calves per experimental group). Dotted horizontal lines indicate the approximate limit of detection for the qPCR assay. d Scatter plot showing the area under the curve (AUC) for Log10 transformed fecal oocyst shedding for individual animals. The lines indicate means and SD. Asterisk (*) indicates p < 0.02 compared with the corresponding vehicle control by one-way ANOVA with Dunnett’s Correction for multiple comparisons. e and f Scatter plots showing the AUC for the diarrhea and dehydration scores for individual animals receiving each treatment regimen. The lines indicate means and SD. Asterisk (*) indicates p < 0.02 compared with the corresponding vehicle control by one-way ANOVA with Dunnett’s Correction for multiple comparisons

