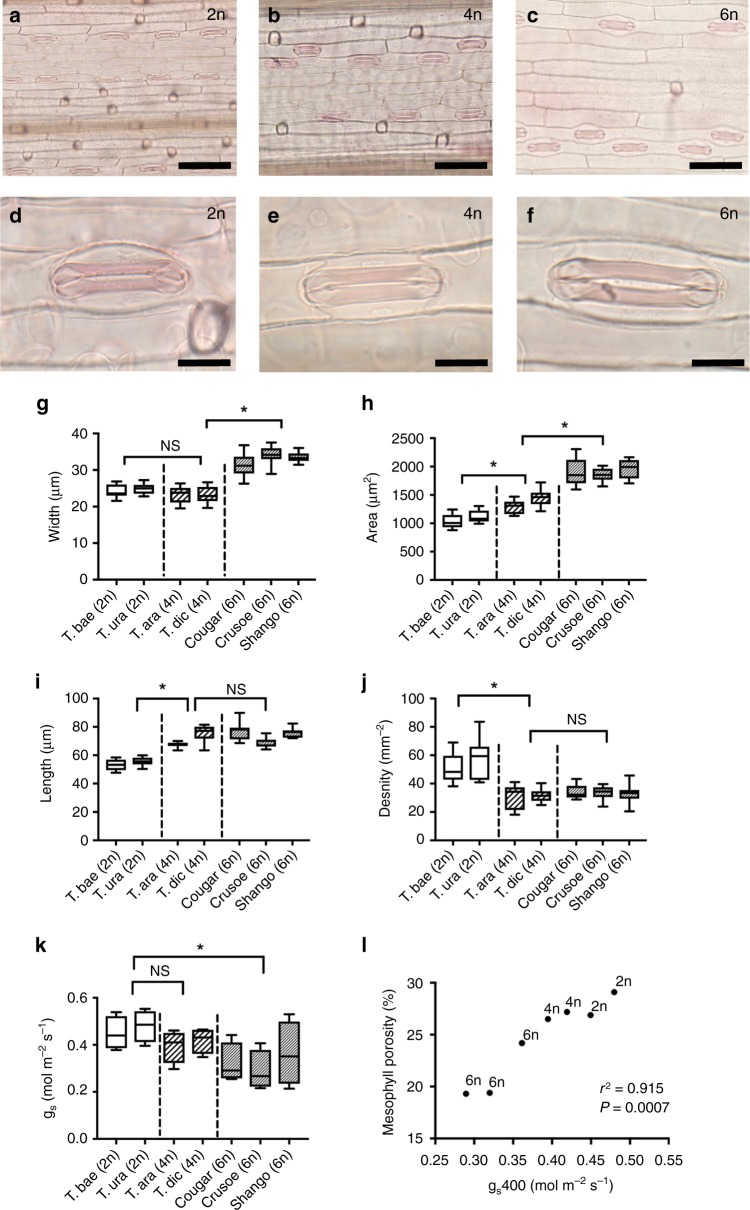
Fig. 1.
Stomatal patterning shifts with ploidy level in wheat. Sample images of overall stomatal distribution along the adaxial epidermis (a–c) and individual stomatal complexes (d–f) in Triticum baeoticum (2n; a, d), T. araraticum (4n; b, e) and T. aestivum cv Cougar (6n; c, f). Scale bar a–c = 80 µm; d–f = 20 µm. Stomatal width (g) (ANOVA, F(2,81) = 169.5, P < 0.0001), area (h) (ANOVA, F(2,81) = 218.7, P < 0.0001), length (i) (ANOVA, F(2,73) = 80.29 p < 0.0001), density (j) (ANOVA, F(2,81) = 61.21 P < 0.0001), and conductance, gs (k) (ANOVA, F(2,25) = 7.494, P = 0.0028) are shown for all analysed wheat lines. Results of a posthoc Tukey test comparing sequential ploidy levels are indicated within each analysis, with an asterisk when significant at the p < 0.05 level or NS when not significant. For g–k, data are shown as box plots (25th−75th percentile, horizontal line = median) with whiskers indicating maximum and minimum values, n = 6. l For each analysed wheat line, mean mesophyll porosity is plotted against mean stomatal conductance, gs, with ploidy level indicated for each point. Results of correlation analysis are presented (Pearson r2 value). Results for individual paired data are shown in Supplementary Fig. 2

