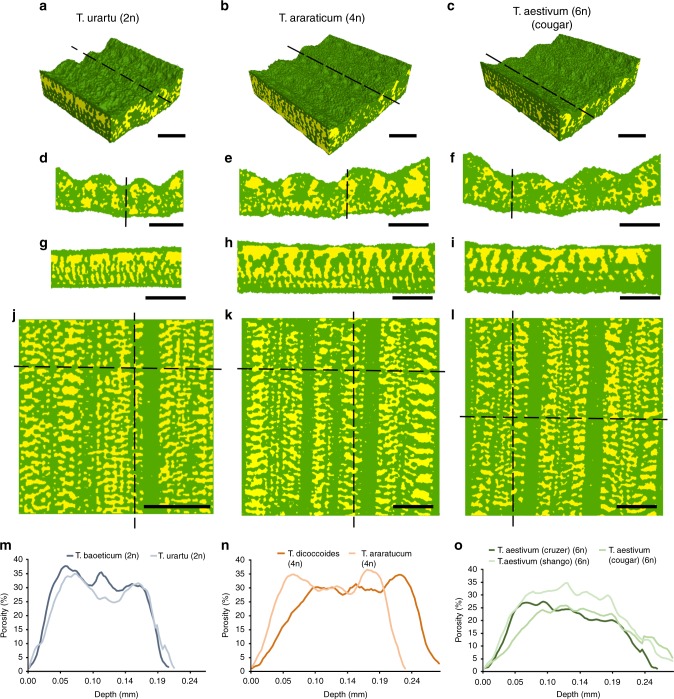
Fig. 2.
MicroCT imaging reveals variation in wheat leaf airspace with ploidy. Sample leaf images of Triticum urartu (2n), T. araraticum (4n) and T. aestivum cv Cougar (6n) in 3D renderings of tissue blocks (a–c), transverse sections (d–f), longitudinal sections (g–i), and paradermal sections (j–l), with solid tissue in green and airspace in yellow. Mesophyll porosity (%) (m–o) is plotted along leaf depth from adaxial to abaxial surfaces in the diploid (m), tetraploid (n), and hexaploid (o) lines, as indicated. T. baoeticum–dark blue; T. urartu–light blue; T. dicoccoides–dark orange; T. araraticum–light orange; T. aestivum (Crusoe)–dark green; T. aestivum (Cougar)–mid-green; T. aestivum (Shango)–light green. For clarity, only mean values of 6 replicated samples are presented in panels m–o. Lines in a–c indicate plane of section in g–i, respectively, also indicated by vertical lines in j–l. Horizontal lines in j–l indicate plane of section for d–f, respectively. Image resolution = 2.75 µm. Scale bars a–l = 200 µm

