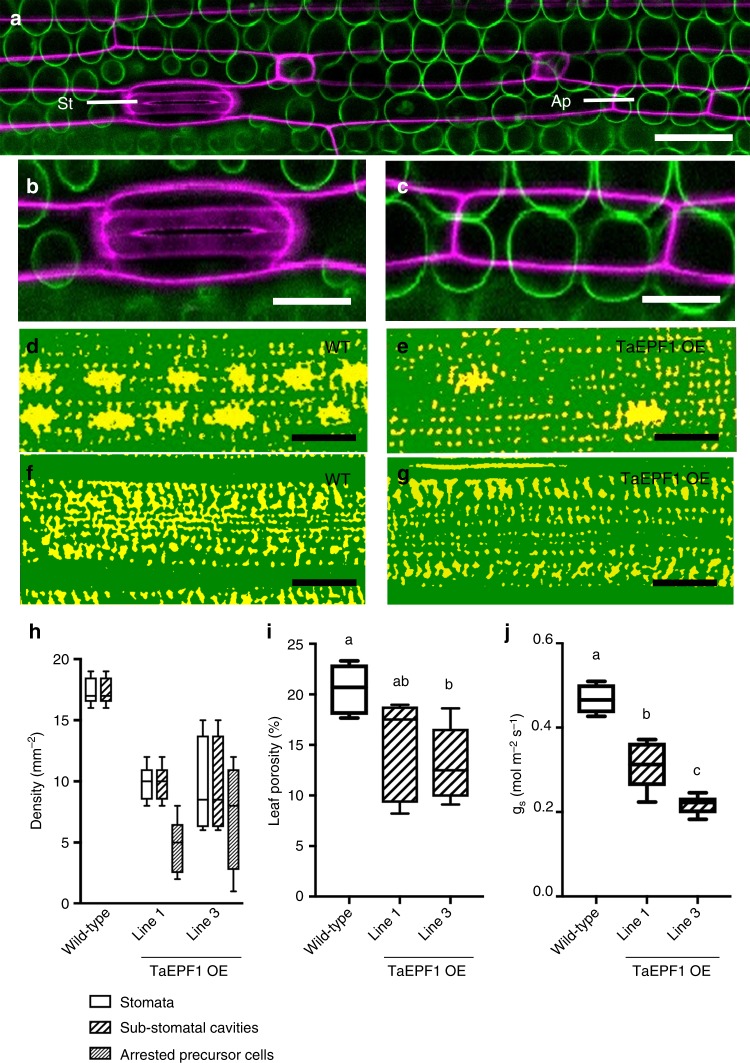
Fig. 3.
EPF overexpression arrests sub-stomatal cavity development and decreases mesophyll porosity in wheat. a Confocal overview of a TaEPF1 OE wheat leaf showing epidermal layer (purple), subtending mesophyll cells (green), a stomate (St) consisting of guard cells and associated subsidiary cells and, in the same file, an arrested stomatal precursor (Ap). Scale bar = 60 µm. b, c Higher resolution images of (b) the stomate and (c) arrested stomatal precursor cell shown in a. Scale bars = 40 µm. d–g microCT images of a wild-type (WT) (d, f) and a TaEPF1 OE leaf (e, g) in a paradermal plane within the mesophyll directly subtending the epidermis (d, e) or deeper in the leaf (f, g), with solid tissue in green and airspace in yellow. The larger airspaces in d, e indicate sub-stomatal cavities. Note fewer sub-stomatal cavities in the TaEPF1 OE leaf. Scale bars = 100 µm. h–j In WT wheat and two independent lines of transgenic wheat overexpressing TaEPF1 (as indicated), (h) the density of stomata (n = 87), sub-stomatal cavities (n = 87) and arrested stomata precursor cells (n = 52 from 5 independent leaves); (i) mesophyll porosity as measured from microCT analysis (ANOVA, F(2,12) = 4.977, p = 0.027); and (j) stomatal conductance, gs, are shown (ANOVA, F(2,12) = 46.86, p < 0.0001). For i and j a posthoc Tukey analysis was performed (n = 5). Lines sharing the same letter are indistinguishable from each other at the p < 0.05 confidence limit. Data (h–j) are shown as box plots (25th–75th percentile, horizontal line = median) with whiskers indicating maximum and minimum values

