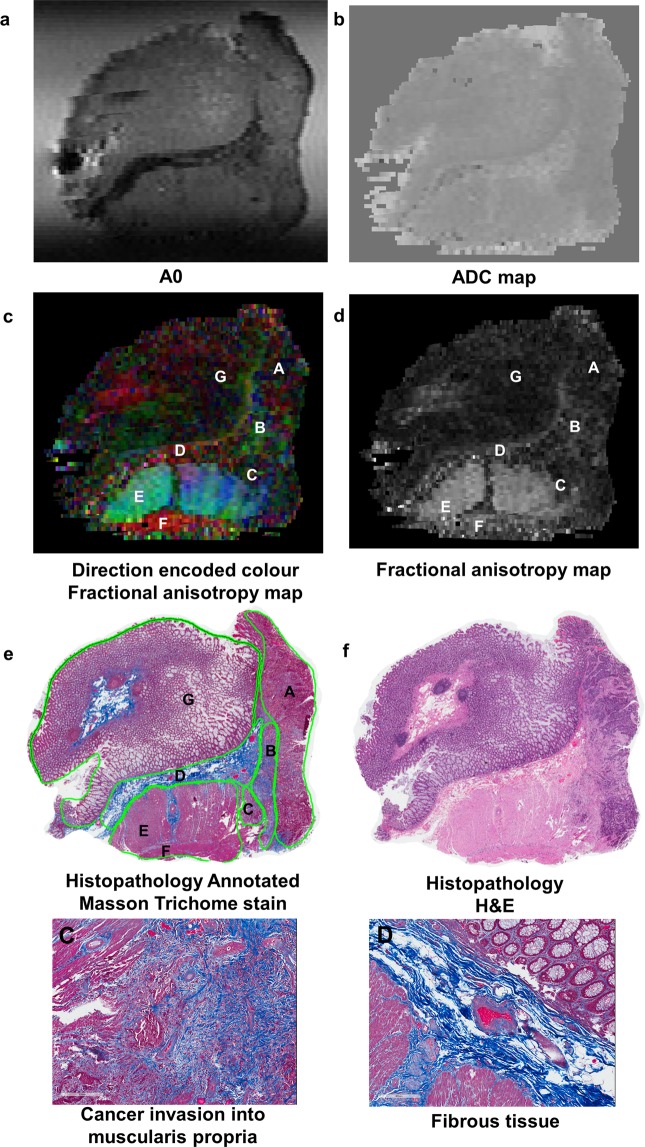
Figure 2.
High field DTI-MRI and histopathology correlation results for rectal cancer tissue specimen 1. The DTI-MRI images shown are (a) A0, (b) ADC map, (c) direction encoded colour fractional anisotropy (FA) map, and (d) FA map. The corresponding histopathology is shown in (e) and (f). The annotated regions on the diffusion tensor image and histopathology (including zoomed images) are: A cancer B desmoplasia C cancer invasion into muscularis propria D fibrous tissue E muscularis propria inner circular layer F muscularis propria outer circular layer and G mucosa. The A0 image was able to identify the band of fibrous tissue which had lower signal intensity. Cancer appeared hypointense on the ADC map, indicating restricted diffusion in cancer. The direction encoded colour FA map was the best MRI image for distinguishing the different tissue regions of interest; cancer and muscularis propria were most clearly distinguished on this image.

