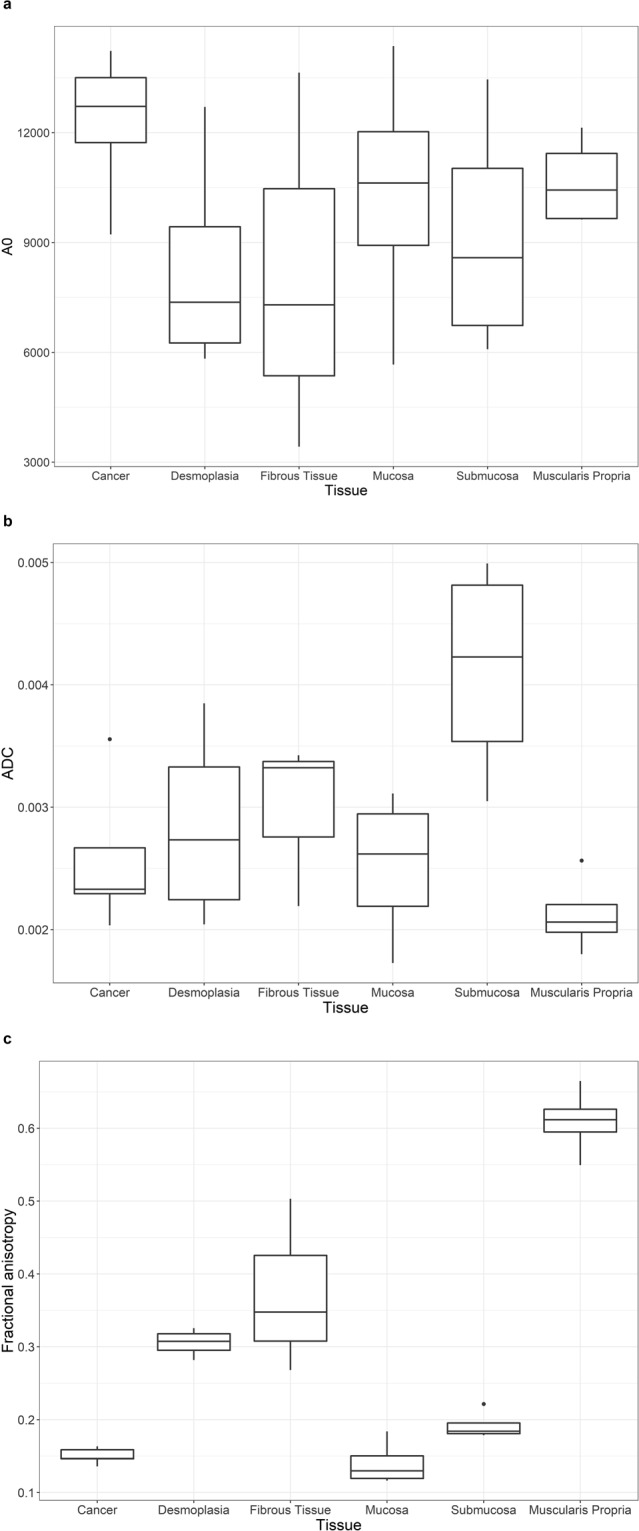
Figure 6.

Box plots of (a) A0, (b) apparent diffusion co-efficient (ADC) and (c) fractional anisotropy (FA) values for each tissue region of interest for all patients. The boxes represent the 25th to 75th percentile (interquartile range), the lines within the box represent the median values and the whiskers show the range of values. The dots are outliers. The box plots showed that FA had the clearest contrast between cancer and desmoplasia, fibrous tissue and muscularis propria.
