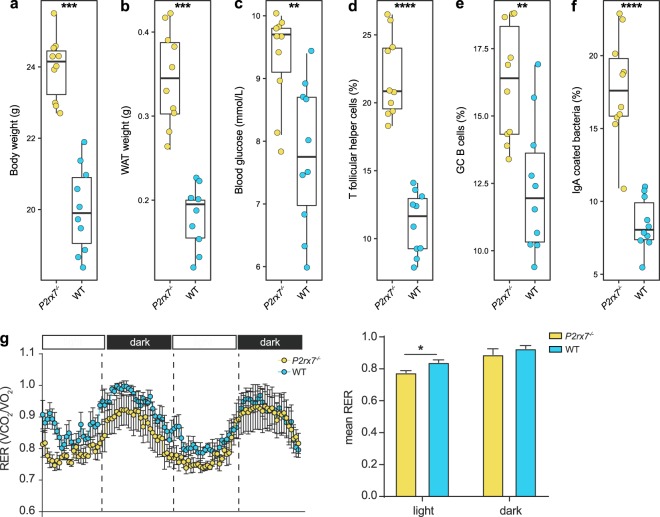
Figure 1.
Alteration of metabolic and immunological parameters in P2rx7−/− mice. (a) Body weight, (b) WAT weight, (c) blood glucose, (d) % of Tfh cells in PPs, (e) % of GC B cells in PPs, (f) % of faecal IgA-coated bacteria in P2rx7−/− (yellow) and WT (blue) mice. Box plots are defined by the 25th and 75th percentiles. Centre line represents the median (50th percentile). Whiskers are defined as 1.5 times the interquartile range from the 25th or 75th percentiles. (g) Dynamic pattern of respiratory exchange ratio (RER) and relative mean RER values during the light and dark phase in WT and P2rx7−/− mice (the displayed experiment is representative of three). *p < 0.05, **p < 0.01, ***p < 0.001, **** p < 0.0001, Wilcoxon rank-sum test; n = 10 per group.

