Fig. 1.
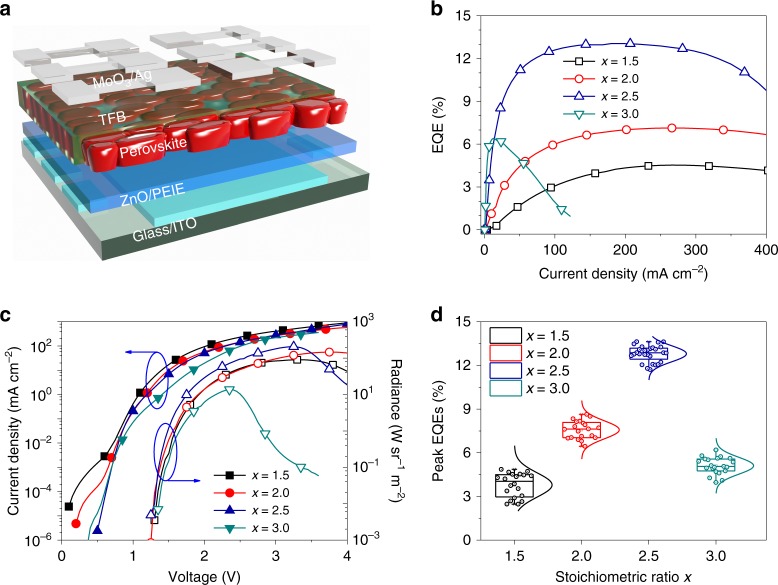
Perovskite LEDs processed from precursors with excess FAI. a Schematic diagram of the device architecture of the perovskite LEDs in this work (ITO/ZnO/PEIE/perovskite/TFB/MoO3/Ag). b–d EQE-J (b), J & R-V curves (c), and statistical distributions of peak EQEs (d) of perovskite LEDs fabricated from precursors with different x values (x = 1.5, 2.0, 2.5 and 3.0). For all box plots, the line in the center is the median value. The interquartile range (IQR) represents 25th-75th percentile of the EQE values. Whiskers show the extent of the whole EQE values, extending to 1.5 IQR in box-plots

