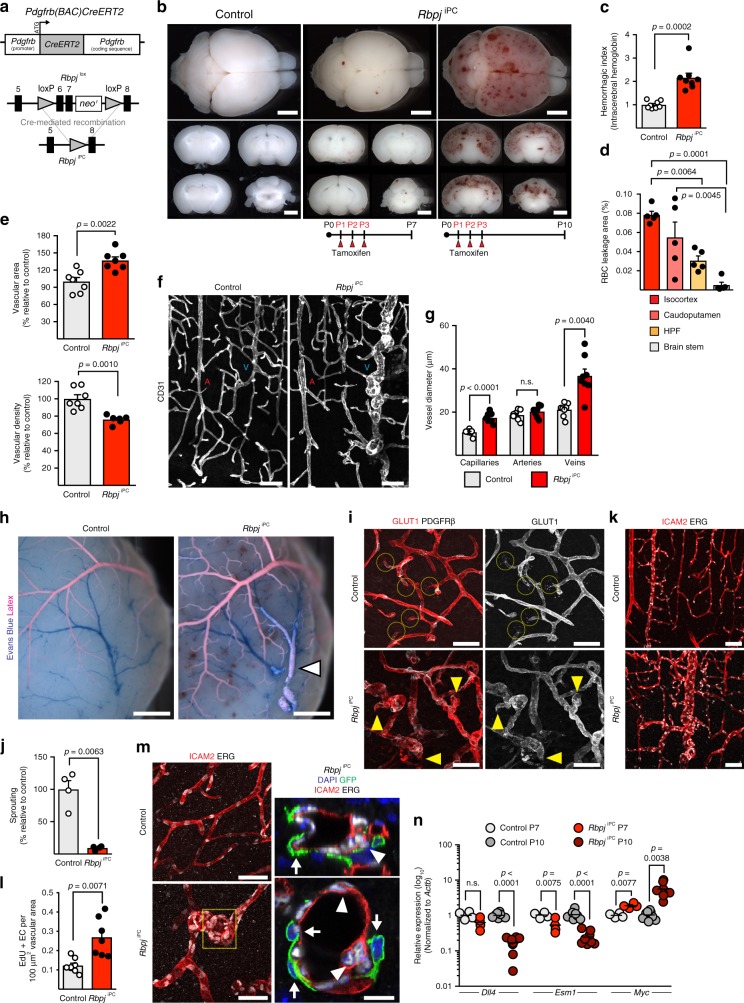
Fig. 1.
Pdgfrb-CreERT2-mediated Rbpj deletion compromises brain vessels. a Pdgfrb-CreERT2 transgene and Cre-mediated recombination of Rbpjlox allele. b Whole brains and coronal sections from control and RbpjiPC mice at P7 or P10 after tamoxifen administration (P1–P3). Scale bar, 2 mm. c Haemorrhagic index. p-values, Mann–Whitney U-test, n = 8. d Red blood cell (RBC) extravasation in brain parenchyma. HPF, hippocampal formation. p-values, one-way ANOVA and Tukey’s test, n = 5. e Vascular area and density in brain cortices. p-values, Student’s t-test, n = 6–7. f Confocal images of blood vessels (CD31+, white) in brain cortices. Arteries (A) and veins (V) are indicated. Scale bar, 100 μm. g Quantitation of vessel diameter in cortical blood vessels. p-values, Brown–Forsythe and Welch one-way ANOVA with Tamhane’s T2 test, n = 4. n.s., not statistically significant. h Arteriovenous malformation in brain superficial vasculature as revealed by the presence of latex in the caudal rhinal vein (arrowhead). Scale bar, 1 mm. i Confocal images of cortical blood vessels stained for GLUT1 (red, white) and PDGFRβ (white). Normal sprouts (dashed circles) replaced by blunt-ended capillaries (yellow arrowheads) in RbpjiPC mice. Scale bar, 50 μm. j Quantitation of sprouting in brain cortices. p-values, Welch’s t-test, n = 4. k Confocal images of blood vessels (ICAM2+, red) and EC nuclei (ERG+, white) in brain cortices. Scale bar, 100 μm. l Quantitation of EC proliferation in blood vessels of P7 mice. p-values, Welch’s t-test, n = 7–8. m Confocal images of cortex capillaries stained for ICAM2 (red), ERG (white), and GFP (green, recombined mural cells). Right panel shows single optical sections of boxed inset in RbpjiPC (left column). Recombined pericytes (white arrows) around tangled capillaries with superimposed EC nuclei (white arrowheads). Scale bar, 50 μm (left panels) and 10 μm (high magnifications). n RT-qPCR analysis in sorted ECs from brain cortices of P7 and P10 mice. p-values, Brown–Forsythe and Welch one-way ANOVA with Tamhane’s T2 test for Dll4 and Myc; one-way ANOVA with Sidak’s test for Esm1, n = 4–8. All images correspond to P10 mice unless otherwise indicated. Error bars represent s.e.m. Source data are provided as a Source Data file

