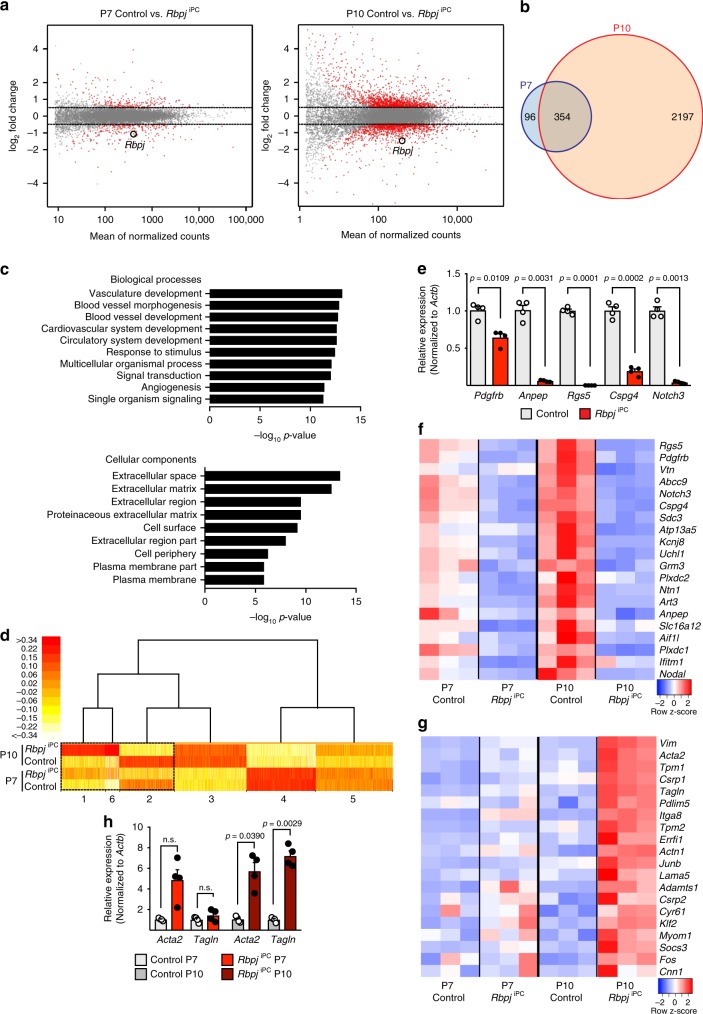
Fig. 3.
Transcriptome profiling of RbpjiPC mural cells. a MA-plots of DEGs between P7 and P10 control and RbpjiPC mutant mural cells. The x-axis represents the mean normalized counts and the y-axis shows the log2 fold change >0.5. Red dots correspond to statistically significant DEGs. Rbpj is indicated. b Venn diagram showing the overlap in DEGs between control and RbpjiPC mutant mural cells at P7 and P10. c Top gene ontology (GO) biological process and cellular components terms related to differentially expressed genes in P7 RbpjiPC mural cells (FDR, corrected p-value). d Model-based hierarchical clustering heat map of transcripts from control and RbpjiPC mural cells at P7 and P10. Boxed region (dashed line) correspond to gene clusters which are consistently up (1 and 6) or downregulated (2) in RbpjiPC mice both at P7 and P10 stages. e RT-qPCR analysis of putative pericyte markers in sorted mural cells from P10 control and RbpjiPC brain cortices. p-values, Brown–Forsythe and Welch one-way ANOVA with Tamhane’s T2 test, n = 4. f Heat map representation of known pericyte markers and recently proposed pericyte-enriched genes downregulated in RbpjiPC mural cells at P7 and P10. g Heat map representation of arterial/arteriolar vascular SMC-enriched genes upregulated in RbpjiPC mural cells at P7 and P10. h RT-qPCR analysis of vascular SMC markers in sorted mural cells from P7 and P10 control and RbpjiPC brain cortices. p-values, Brown–Forsythe and Welch one-way ANOVA with Tamhane’s T2 test, n = 4. Error bars represent s.e.m. Source data are provided as a Source Data file

